nxgrph
Main Functionality
Draw a fully customizable energy system graph. |
Standalone API
Draw a Graph's nodes using the |
|
Draw a Graph's node labels using |
|
Draw a Graph's edges using |
|
Draw a Graph's edge labels using |
|
Draw a legend using |
Example Implementations/Convenience Wrappers
Example for a visually enhanced energy graph drawing. |
|
Examplary code for a numerically enhanced energy graph drawing. |
nxgrph is a tessif
interface drawing networkx.Graph like objects. Designed to be used as
programmatic interface with the option for quick and easy humanly invoked
tweaks.
Visualizing graphs using nxgrph builds on
providing data in a 3-fold parameter system:
dfltsare provided bytessif.frused.defaults.nxgrph_visualize_defaultsserving as fallback data to garantuee a graph can be drawn.
attributelike parameters are (supposedly) provided by atessif.transform.es2mapping.base.ESTransformerchild and will overwrite defaults (seenode_data)
kwargsalllow human intervention and will overwrite programmatic input
Note
To make use of the programmatic interface see the
tessif.transform.es2mapping module. Choose one of the hard coded
tessif.transform.es2mapping.base.ESTransformer childs, or create one
of your own and supply it to draw_graph.formatier.
Example
Highlighting the edge from 1 to 2 and the node 0 in a 3-complete graph using ‘human intervention’:
>>> import matplotlib.pyplot as plt
>>> import networkx as nx
>>> import tessif.visualize.nxgrph as nxv
>>> G = nx.complete_graph(3)
>>> grphdrw = nxv.draw_graph(
...     G, node_color={0: 'red'}, edge_color={(1, 2): 'red'})
Visualizing a results transformed ES simulation model - Design Case:
Handle imports:
>>> import tessif.examples.data.omf.py_hard as omf_examples
>>> from tessif.transform.es2mapping import omf as tomf
>>> from tessif.transform import nxgrph as nxt
Simulate energy system (using oemof in this case):
>>> es = omf_examples.create_star()
Choose ES dependend
Resultiersand/orFormatiersof your liking:
>>> formatier = tomf.AllFormatier(es, cgrp='carrier')
>>> grph = nxt.Graph(tomf.LoadResultier(es))
Tweak edge width a little:
>>> for key, value in formatier.edge_data()['edge_width'].items():
...     formatier.edge_data()['edge_width'][key] = 3 * value
Draw the graph:
>>> grphdrw = nxv.draw_graph(grph, formatier=formatier, layout='neato')
>>> plt.draw()
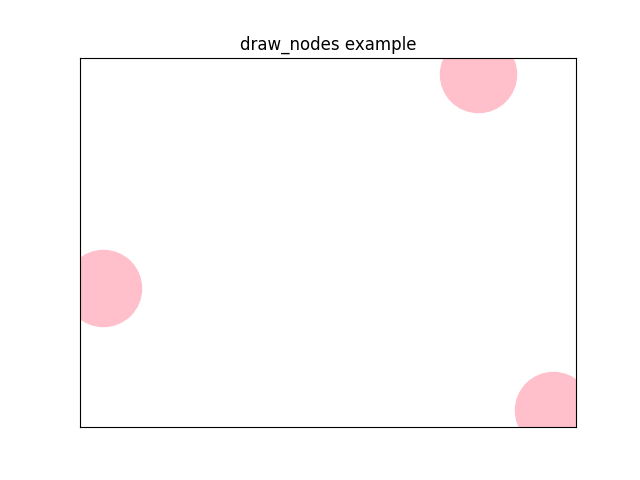
- tessif.visualize.nxgrph.draw_nodes(grph, pos, node_attr, dflts, draw_fency_nodes=True, fltr='', xcptns=[], **kwargs)[source]
Draw a Graph’s nodes using the
draw_networkx_nodes()Convenience wrapper for tweaking a nodes’s position, shape, size and color. Designed to be called by
draw_graph(). Nonetheless usable as standalone drawing utility.- Parameters:
grph¶ (
networkx.Graphlike) – The graph object to be drawn.pos¶ (dict) – A dict with nodes as keys and positions as values
A dict with attribute names as keys and dicts as values. Value dicts consist of nodes as keys and attribute parameters as values:
{attr_name: {node: attr_parameter}}
Designed to be returned by a
ESTransformerobject.Use one of those for automated node designs. Will be unpacked and passed as kwargs to
draw_networkx_nodes()A dict with attribute names as keys and default parameters as values:
{attr_name: default}
Designed to be returned by a
ESTransformerchild.Use this dictionairy to key all the attributes you want be accessed during drawing. The
node_attrwill be filled with all attributes missing and after that populated with thekwargsvalues.Whether to use visualization to highlight node attributes or not.
If
True:nodes of variable size are visualized with outer fading circles
nodes of explicitly stated size are visualized using the
node_fill_sizeattribute
If
False:nodes of variable size are drawn as filled circle at default size
nodes of explicitly stated size are drawn as filled circles
kwargsfilter strings. Kwargs havingfltrin them will be stripped of the filter keyword and passed on for drawing.For filtering without stripping list the respective kwarg in
xcptnsAllows for wrapping the function with other drawing subutilities into a toplevel function like
draw_graph()wihtout sacrificing the possibility to manipulate each sublevel call viakwargs.xcptns¶ (sequence of str (default=[])) –
Sequence of key word arguments that won’t be stripped of the
fltr.Whether a kwarg should be stripped or not, depends on the naming convention of
draw_networkx_nodes(). Make sure to checkout their documentation to get expected behaviour.kwargs¶ –
If you don’t want to make use of a
ESTransformerchild. you can “manually” format your nodes using keyword arguments. They can either be the same for all nodes as in:node_size=10
Or dictionairies using nodes as keys and attribute parameters as values as in:
node_size={'node_1': 10, 'node_2': 3}
Nodes not present as keys will be set as defined in
dflts. Seedraw_networkx_nodes()for supported kwargs.
- Returns:
node_draws – list of
matplotlib.collections.PathCollectionrepresenting the nodes- Return type:
Notes
Current implementation needs
node_fill_sizeentries to be present in allnode_attrnode dicts (of the nodes beeing drawn) for drawing fency nodes. Hence it is recommended to have a default entry ofnode_fill_sizein thedfltsdict.Examples
>>> import matplotlib.pyplot as plt
>>> import networkx as nx
>>> import tessif.visualize.nxgrph as nxv
>>> from collections import defaultdict
>>> G=nx.complete_graph(3)
>>> pos=nx.spring_layout(G)
>>> node_attr=defaultdict(dict)
>>> defaults={'node_uid': None, 'node_size': 3000, 'node_shape':'o',
... 'node_fill_size': 3000, 'node_color': 'green', 'node_alpha': 1.0}
>>> fltr='node_'
>>> xcptns=['node_size', 'node_color', 'node_shape', 'node_fill_size']
>>> node_draws = nxv.draw_nodes(
...     G, pos ,node_attr, defaults, draw_fency_nodes=False,
...     fltr=fltr, xcptns=xcptns, node_color='pink')
>>> print(list(map(type, node_draws))[0])
<class 'matplotlib.collections.PathCollection'>
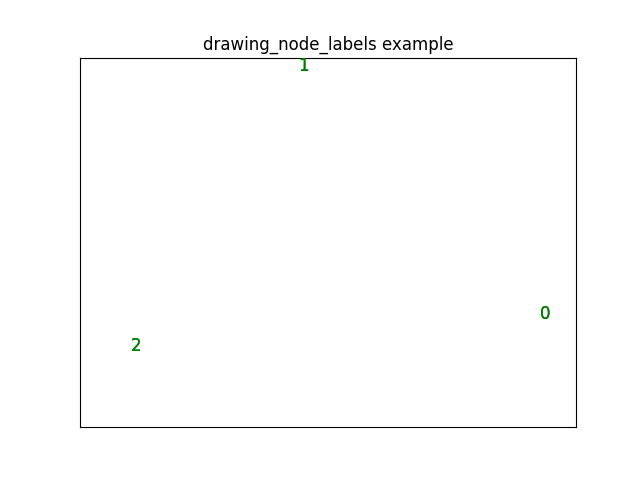
- tessif.visualize.nxgrph.drawing_node_labels(grph, pos, node_attr, dflts, fltr='', xcptns=[], **kwargs)[source]
Draw a Graph’s node labels using
draw_networkx_labels()Convenience wrapper for tweaking node label appearances. Designed to be called by
draw_graph(). Nonetheless usable as standalone drawing utility.- Parameters:
grph¶ (
networkx.Graphlike) – The graph object to be drawn.pos¶ (dict) – A dict with nodes as keys and positions as values
A dict with attribute names as keys and dicts as values. Value dicts consist of nodes as keys and attribute parameters as values:
{attr_name: {node: attr_parameter}}
Designed to be returned by a
ESTransformerchild.Use one of those for automated node label designs. Will be unpacked and passed as kwargs to
draw_networkx_labels()A dict with attribute names as keys and default parameters as values:
{attr_name: default}
Designed to be returned by a
ESTransformerchild.Use this dictionairy to key all the attributes you want be accessed during drawing. The
node_attrwill be filled with all attributes missing and after that populated with thekwargsvalues.kwargsfilter strings. Kwargs havingfltrin them will be stripped of the filter keyword and passed on for drawing.For filtering without stripping list the respective kwarg in
xcptnsAllows for wrapping the function with other drawing subutilities into a toplevel function like
draw_graph()wihtout sacrificing the possibility to manipulate each sublevel call viakwargs.xcptns¶ (sequence of str (default=[])) –
Sequence of key word arguments that won’t be stripped of the
fltr.Whether a kwarg should be stripped or not, depends on the naming convention of
draw_networkx_labels(). Make sure to checkout their documentation for getting expected behaviour.kwargs¶ –
If you don’t want to make use of a
ESTransformerchild. you can “manually” format your nodes using keyword arguments. They can either be the same for all nodes as in:font_color='black'
Or dictionairies using nodes as keys and attribute parameters as values as in:
font_color={'node_1': 'red', 'node_2': 'blue'}
Nodes not present as keys will be set as defined in
dflts. Seedraw_networkx_labels()for supported kwargs.
- Returns:
node_uid_draws –
matplotlib.text.Textobjects representing the drawn node labels keyed by label as in:{'node_uid': Text('drawn_label')}- Return type:
Notes
Current (August 2019) implementation of
draw_networkx_labels()does not need anydfltsorxcptnsto be defined.Examples
Drawing node labels (Cryptic
print()is to demonstrate return):>>> import matplotlib.pyplot as plt >>> import networkx as nx >>> import tessif.visualize.nxgrph as nxv >>> from collections import defaultdict >>> G=nx.complete_graph(3) >>> pos=nx.spring_layout(G) >>> node_attr=defaultdict(dict) >>> defaults={'node_uid': None} >>> fltr='node_' >>> node_uid_draws = nxv.drawing_node_labels( ... G, pos, node_attr, defaults, fltr=fltr, ... font_color='red', node_font_color='green') >>> print( ... list(k for k in node_uid_draws)[0], ':', ... list(map(type, (v for v in node_uid_draws.values())))[0]) 0 : <class 'matplotlib.text.Text'>
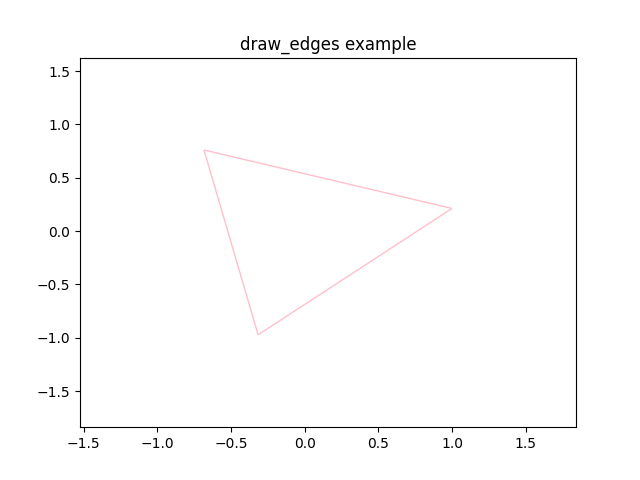
- tessif.visualize.nxgrph.draw_edges(grph, pos, edge_attr, node_attr, dflts, fltr=('', ''), xcptns=([], []), **kwargs)[source]
Draw a Graph’s edges using
draw_networkx_edges().Convenience wrapper for tweaking an edge’s position shape, size and color. Designed to be called by
draw_graph(). Nonetheless usable as standalone drawing utility.- Parameters:
grph¶ (
networkx.Graphlike) – The graph object to be drawn.pos¶ (dict) – A dict with nodes as keys and positions as values
A dict with attribute names as keys and dicts as values. Value dicts consist of tuples of inflow node and target node as keys and attribute parameters as values:
{attr_name: {(inflow, node): attr_parameter}}
Designed to be returned by a
ESTransformerchild.Use one of those for automated edge designs. Will be unpacked and passed as kwargs to
draw_networkx_edges().node_attr¶ (dict of dict) – Used to acces
node_shapeandnode_sizeattributes to correctly display edges when using custom node sizes and shapes. See alsonode_attr.A dict with attribute names as keys and default parameters as values:
{attr_name: default}
Designed to be returned by a
ESTransformerchild.Use this dictionairy to key all the attributes you want be accessed during drawing. The
edge_attrwill be filled with all attributes missing and after that populated with thekwargsvalues.fltr¶ (2-tuple of str (default=('',''))) –
draw_edges.kwargsfilter strings. Kwargs havingdraw_edges.fltrin them will be stripped of the filter keyword and passed on for drawing.For filtering without stripping list the resptive kwarg in
xcptnsAllows for wrapping the function with other drawing subutilities into a toplevel function like
draw_graph()wihtout sacrificing the possibility to manipulate each sublevel call viakwargs.xcptns¶ (2-tuple of iterable of str (default=([],[]))) –
2-tuple of iterable of key word arguments that won’t be stripped of the
fltr.Whether a kwarg should be stripped or not, depends on the naming convention of
draw_networkx_edges(). Make sure to checkout their documentation to get expected behaviour.kwargs¶ –
If you don’t want to make use of a
ESTransformerchild. you can “manually” format your edges using keyword arguments. They can either be the same for all edges as in:edge_width=10
Or dictionairies using edge tuples as keys and attribute parameters as values as in:
edge_width={('node_1', 'node_2'): 10, ('node_1': 'node_3'): 3}
Edges not present as keys will be set as defined in
dflts. Seedraw_networkx_edges()for supported kwargs.
- Returns:
edge_draws – list of
matplotlib.patches.FancyArrowPatchrepresenting the edges- Return type:
Notes
Current implementation needs
node_sizeandnode_shapeentries to be present in either theedge_attrdict or in thedfltsdict. (With the last beeing recommended)Examples
>>> import matplotlib.pyplot as plt
>>> import networkx as nx
>>> import tessif.visualize.nxgrph as nxv
>>> from collections import defaultdict
>>> G=nx.complete_graph(3)
>>> pos=nx.spring_layout(G)
>>> edge_attr=defaultdict(dict)
>>> node_attr=defaultdict(dict)
>>> defaults={'node_size': 3000, 'node_shape':'o',
... 'edge_width': 1, 'edge_color': 'black',
... 'edge_arrowstyle': 'simple', 'edge_arrowsize': 7,
... 'edge_vmin': 0.0, 'edge_vmax': 1.0, 'edge_cmap': plt.cm.Greys}
>>> fltr=('node_', 'edge_')
>>> xcptns=(['node_size', 'node_shape'],
... ['edge_color', 'edge_vmin', 'edge_vmax', 'edge_cmap'])
>>> edge_draws = nxv.draw_edges(G, pos, edge_attr, node_attr, defaults,
... fltr=fltr, xcptns=xcptns, edge_color='pink')
>>> print(list(map(type, edge_draws))[0])
<class 'matplotlib.collections.LineCollection'>
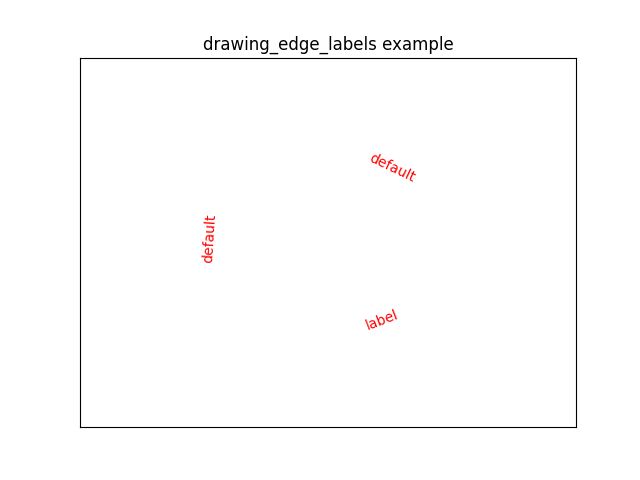
- tessif.visualize.nxgrph.drawing_edge_labels(grph, pos, edge_attr, dflts, fltr='', xcptns=[], **kwargs)[source]
Draw a Graph’s edge labels using
draw_networkx_edge_labels().Convenience wrapper for tweaking edge label appearances. Designed to be called by
draw_graph(). Nonetheless usable as standalone drawing utility.- Parameters:
grph¶ (
networkx.Graphlike) – The graph object to be drawn.pos¶ (dict) – A dict with nodes as keys and positions as values
A dict with attribute names as keys and dicts as values. Value dicts consist of tuples of inflow node and target node as keys and attribute parameters as values:
{attr_name: {(inflow, node): attr_parameter}}
Designed to be returned by a
ESTransformerchild.Use one of those for automated edge label designs. Will be unpacked and passed as kwargs to
draw_networkx_edge_labels().A dict with attribute names as keys and default parameters as values:
{attr_name: default}
Designed to be returned by a
ESTransformerchild.Use this dictionairy to key all the attributes you want be accessed during drawing. The
edge_attrwill be filled with all attributes missing and after that populated with thekwargsvalues.kwargsfilter strings. Kwargs havingfltrin them will be stripped of the filter keyword and passed on for drawing.For filtering without stripping list the respective kwarg in
xcptnsAllows for wrapping the function with other drawing subutilities into a toplevel function like
draw_graph()wihtout sacrificing the possibility to manipulate each sublevel call viakwargs.xcptns¶ (sequence of str (default=[])) –
Sequence of key word arguments that won’t be stripped of the
fltr.Whether a kwarg should be stripped or not, depends on the naming convention of
draw_networkx_edge_labels(). Make sure to checkout their documentation to get expected behaviour.kwargs¶ –
If you don’t want to make use of a
ESTransformerchild. you can “manually” format your edges using keyword arguments. They can either be the same for all edges as in:edge_font_color = 'black'
Or dictionairies using tuples of inflow node and target node as keys and attribute parameters as values as in:
edge_font_color = {('n1', 'n2'): 'red', ('n1', 'n3'): 'blue'}
Edges not present as keys will be set as defined in
dflts.See
draw_networkx_edge_labels()for supported kwargs.
- Returns:
edge_label_draws –
matplotlib.text.Textobjects representing the drawn edge labels keyed by edges as in:{('inflow_node', 'target_node'): Text('drawn_label')}- Return type:
Notes
Current (August 2019) implementation of
draw_networkx_edge_labels()does not need anydfltsand onlyedge_labelsto be defined inxcptns.Examples
Drawing edge labels. (Cryptic
print()is to demonstrate return type):>>> import matplotlib.pyplot as plt >>> import networkx as nx >>> import tessif.visualize.nxgrph as nxv >>> from collections import defaultdict >>> G=nx.complete_graph(3) >>> pos=nx.spring_layout(G) >>> edge_attr=defaultdict(dict) >>> defaults={'edge_labels': 'default'} >>> fltr='edge_' >>> xcptns=['edge_labels'] >>> edge_label_draws = nxv.drawing_edge_labels( ... G, pos, edge_attr, defaults, ... fltr=fltr, xcptns=xcptns, edge_font_color='red', ... edge_labels={(0,1): {(0, 1): 'label'}}) >>> print( ... list(k for k in edge_label_draws)[0], ':', ... list(map(type, (v for v in edge_label_draws.values())))[0]) (0, 1) : <class 'matplotlib.text.Text'>
- tessif.visualize.nxgrph.draw_legend(grph, ax, lgnds=[], dflts={}, fltr='', xcptns=[], **kwargs)[source]
Draw a legend using
matplotlib.pyplot.legend().Convenience wrapper for customizing legend drawing.
- Parameters:
grph¶ (
networkx.Graphlike) – The graph object to be drawn.ax¶ (
matplotlib.axes.Axes) – Axes object to draw the legend onIterable of legend kwarg dictionairies as in:
[{'handles': [matplotlib_handle_objects],
  'labels': ['Names'],...}]
One legend will be drawn for each dict. Designed to be provided by an
ESTransformerchild. Allows automated legend design.A dict with attribute names as keys and default parameters as values:
{attr_name: default}
Designed to be returned by a
ESTransformerchild.Use this dictionairy to key all the attributes you want be accessed during legend drawing. The
lgndsitems will be filled with all attributes missing and after that populated with thekwargsvalues.kwargsfilter strings. Kwargs havingfltrin them will be stripped of the filter keyword and passed on for drawing.For filtering without stripping list the respective kwarg in
xcptnsAllows for wrapping the function with other drawing subutilities into a toplevel function like
draw_graph()wihtout sacrificing the possibility to manipulate each sublevel call viakwargs.xcptns¶ (sequence of str (default=[])) –
Sequence of key word arguments that won’t be stripped of the
fltr.Whether a kwarg should be stripped or not, depends on the naming convention of
matplotlib.pyplot.legend()Make sure to checkout their documentation for getting expected behaviour.kwargs¶ –
If you don’t want to make use of a
ESTransformerchild. you can “manually” format your legends using keyword arguments as in:numpoints = 10
Parameters not present as keys will be set as defined in
dfltsormatplotlib.pyplot.legend()provided defaults.See
matplotlib.pyplot.legend()for supported kwargs.
- Returns:
legends – List of
matplotlib.legend.Legendthat were drawn.- Return type:
Notes
Make sure to provide handles and labels, or otherwise there will be no legend.
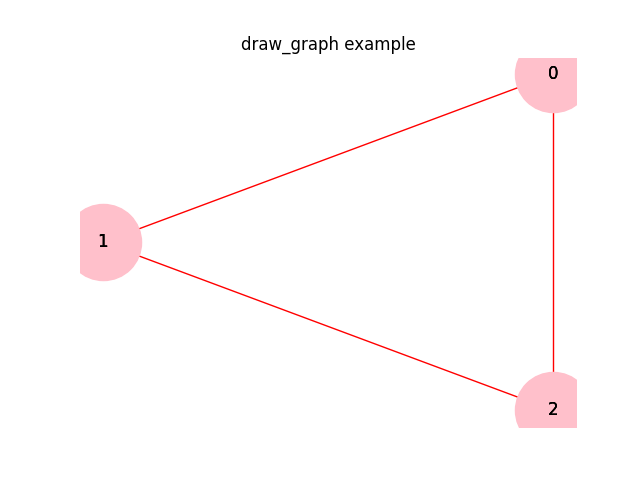
- tessif.visualize.nxgrph.draw_graph(grph, formatier=None, layout='dot', draw_node_labels=True, draw_fency_nodes=False, draw_edge_labels=False, legends=None, defaults={'edge_arrowsize': 7, 'edge_arrowstyle': 'simple', 'edge_cmap': <matplotlib.colors.LinearSegmentedColormap object>, 'edge_color': 'black', 'edge_labels': None, 'edge_len': 1.0, 'edge_minimum_grey': 0.15, 'edge_minimum_weight': 0.1, 'edge_minimum_width': 0.1, 'edge_vmax': 1.0, 'edge_vmin': 0.0, 'edge_width': 1, 'legend_bbox_to_anchor': (1.0, 1), 'legend_borderaxespad': 0, 'legend_labelspacing': 1, 'legend_loc': 'best', 'legend_title': None, 'node_alpha': 1.0, 'node_color': '#AFAFAF', 'node_color_map': ['#AFAFAF'], 'node_fill_size': 3000, 'node_font_size': 11, 'node_font_weight': 'light', 'node_labels': None, 'node_minimum_size': 300.0, 'node_shape': 'o', 'node_size': 3000, 'node_variable_size_scaling': 0.5}, tags=AttributeGroupings(node='node_', edge='edge_', legend='legend_'), exceptions=AttributeGroupings(node=['node_size', 'node_color', 'node_shape', 'node_fill_size'], edge=['edge_labels', 'edge_color', 'edge_vmin', 'edge_vmax', 'edge_cmap'], legend=[]), **kwargs)[source]
Draw a fully customizable energy system graph.
For customizing use automated visual parameter dicts generated by something like
ESTransformeror tweak individual parameters usingdraw_graph.kwargs.- Parameters:
grph¶ (
networkx.Graph-like) – The graph object to be drawn.formatier¶ (
ESTransformer-like,) – Object designed for automating energy system graph design. A collection of graph styling attributes packed inside dictionairies matching the networkx drawing interface demands. default=Nonelayout¶ (str, default='dot') –
String to define the layout used by
networkx.drawing.nx_pydot.graphviz_layout()See the doc page and the documentation for more details on graph layouts.
draw_node_labels¶ (bool, default=True) – Draw node labels if True. See also
drawing_node_labels()draw_fency_nodes¶ (bool ,default=False) – Draw visually verbose nodes if True. See also
draw_nodes.draw_fency_nodesdraw_edge_labels¶ (bool, default=False) – Draw edge labels if True. See also
drawing_edge_labels()legends¶ (
Sequenceof dict, default=None) – Attempt legend drawing Ifnot None. Seedraw_legend.lgndsfor details.defaults¶ (dict) – Dicts providing visual attribute defaults used when
formatierdoes not provide one. default =nxgrph_visualize_defaultstags¶ (tuple) – Tuple of strings used to filter out
kwargs. Field number 0/1 will be interpreted as node/edge tags respectively. default =nxgrph_visualize_tagsexceptions¶ (tuple) – Tuple of
Sequenceobjects containing attrbiute keys not to be stripped ofdraw_graph.tags. Field number 0/1 will be interpreted as node/edge xctpns respectively. default =nxgrph_visualize_xcptnskwargs¶ (key word arguments) –
Unfortunately networkx does not use consistant naming convention when using their kwargs. Edge kwargs are mostly prefixed with
edge_but not all of them (i.e.draw_networkx_edge_labels()).Hence
tessif.visualizeallows prefixing (or tagging in general) ALL keywords. The current tags used to seperate the kwargs are:nxgrph_visualize_tagsThe tags will be stripped of the attribute when passed as unpacked dict to the respective networkx drawing utility. This is of course very susceptible to changes. Let’s hope an appropriate deprecation warning will be thrown when they decide to change that. Simply adding the respective entry to
draw_graph.exceptionswill hopefully ensure future compatibility.For a list of sensible kwargs see also:
- Returns:
graphdraw –
dict containing the drawn data keyed by its elements as in:
{'nodes': draw_nodes(),
 'node_lables': drawing_node_labels(),
 'edges': draw_edges(),
 'edge_labels': drawing_edge_labels(),
 'legends': draw_legend()}
- Return type:
Examples
Using
tessif.frused.defaults.nxgrph_visualize_defaults,tessif.frused.defaults.nxgrph_visualize_tagsandtessif.frused.defaults.nxgrph_visualize_xcptnsfor default drawing.>>> import matplotlib.pyplot as plt >>> import networkx as nx >>> import tessif.visualize.nxgrph as nxv >>> G=nx.complete_graph(3) >>> graphdraw = nxv.draw_graph(G, node_color='pink', edge_color='red') >>> for key, value in graphdraw.items(): ... print(key, ':', type(value[0])) nodes : <class 'matplotlib.collections.PathCollection'> node_uids : <class 'matplotlib.text.Text'> edges : <class 'matplotlib.collections.LineCollection'>
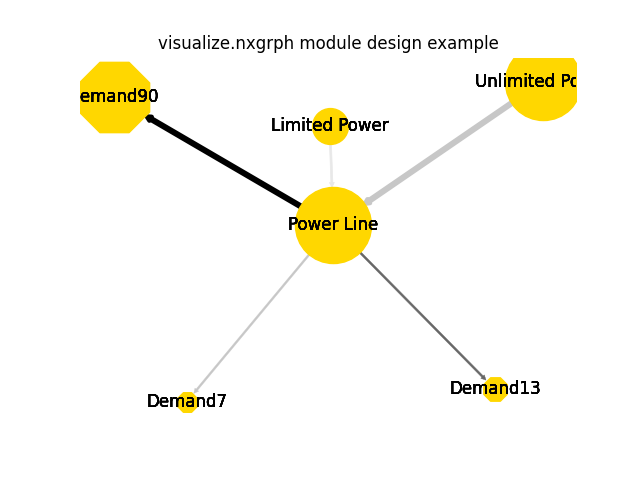
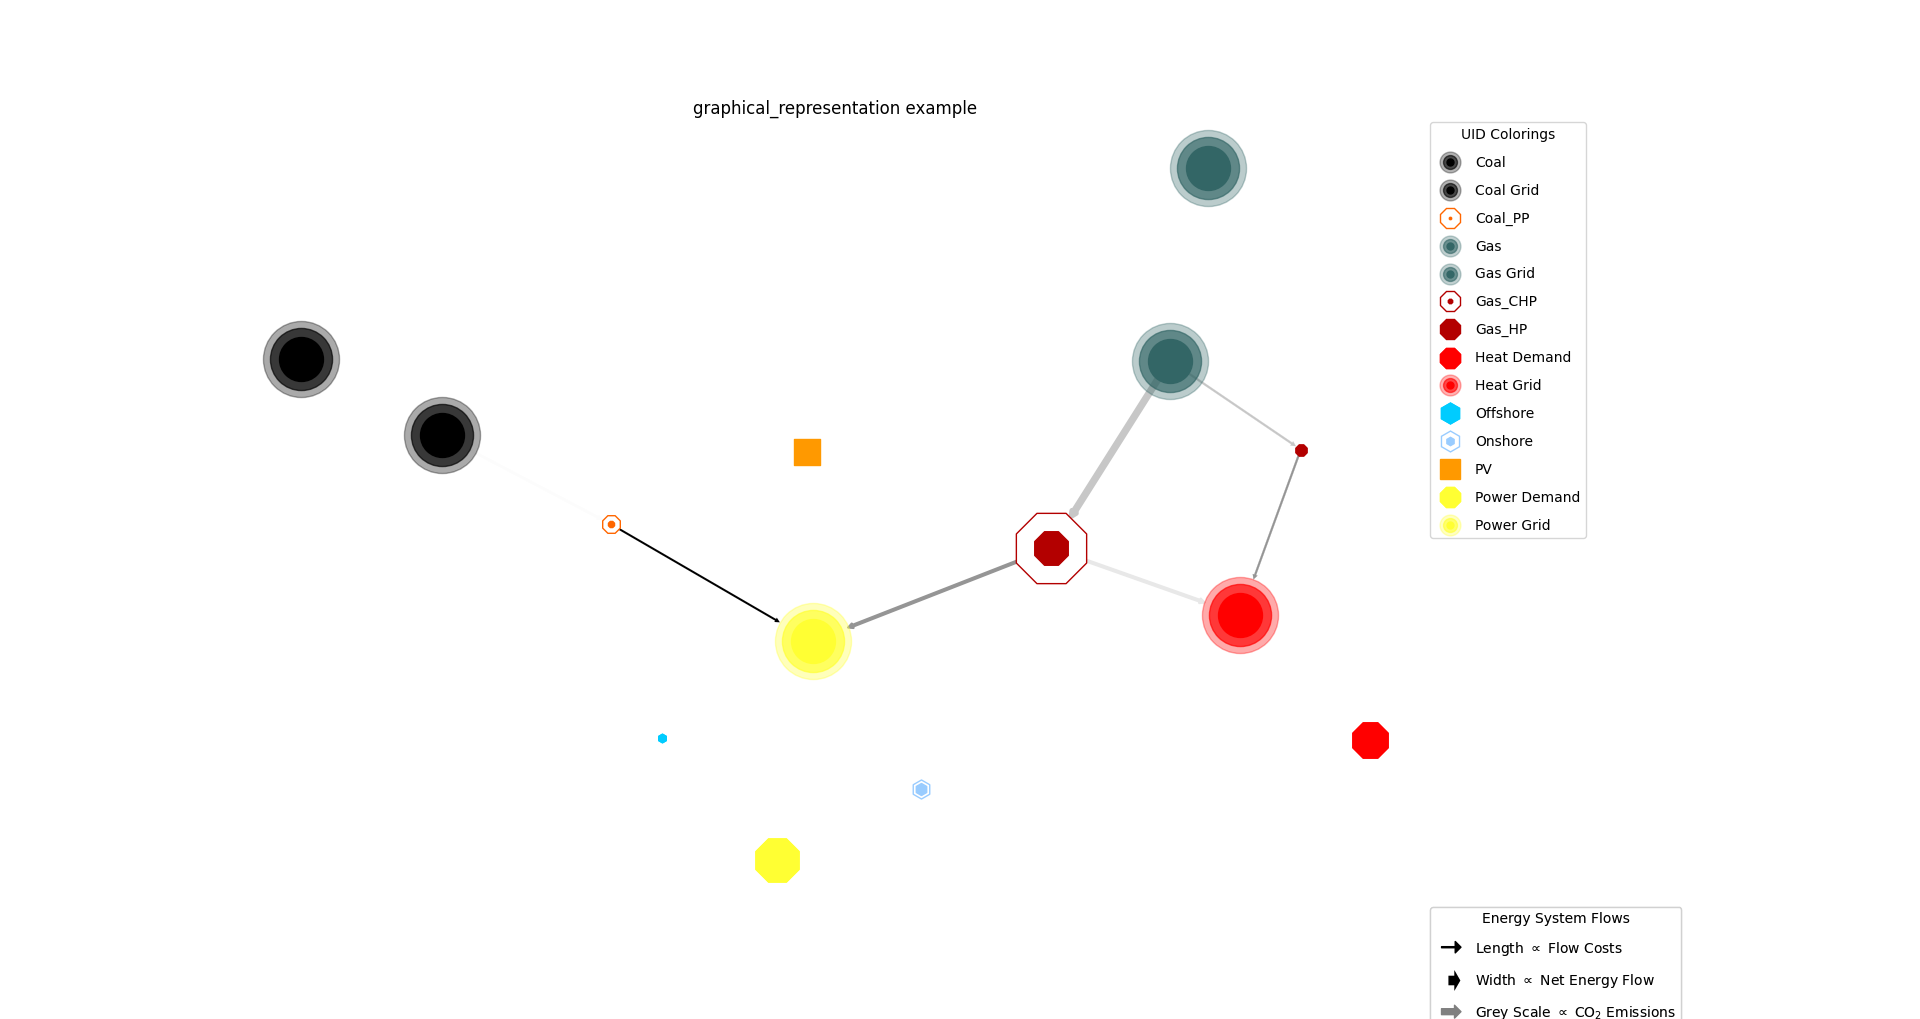
- tessif.visualize.nxgrph.draw_graphical_representation(formatier, colored_by='name', shift_colors=False)[source]
Example for a visually enhanced energy graph drawing.
Mainly designed as reference on how to exploit the dictionairy aggregating capabilities of
draw_graph()and the convenience of aESTransformerchild when trying to usedraw()like functions of networkx.Creates a plain
networkx.DiGraphobject only consisting of nodes and edges found informatier.This plain graph is then provided to
draw_graph()with theformatierproviding manually stated key word arguments.This is of course not the design case, because this behaviour could be easily archived only using
draw_graph()while providing anformatierreturning the desired formats when accessed fornode_dataandedge_data. This however assumes we are commited enough to write our ownESTransformerinstead of simply tweaking the hell out of the ones already hard coded via simple keyword arguments.- Parameters:
formatier¶ (
ESTransformer) – Energy system to dictionairy transformer object returning its data as a 2 layer nested dict in the form of{attribute: {node/edge: parameter}}if accessed fornode_data/edge_datarespectively. As well es a default dictionairy for node and edge attributes.colored_by¶ ({'name', 'carrier', 'sector'}, optional) –
Specification on how to group nodes for coloring. (Respective node color dict provided by a
ESTransformerchild)Default implementations are:
’component’: Searches for keywords in node.label.component
’label’: Searches for keywords in str(node.label)
’carrier’: Searches for keywords in node.label.carrier
’sector’: Searches for keywords in node.label.sector
(Refer to
NodeColorGroupingsfor namedtuple implementation)Note
To try out tweaking things your own way, create a custom Formatier class inheriting
ESTransformerand overwrite_map_node_colors()for additional coloring logic.shift_colors¶ (bool, default=False) – Use a colormap cycle for color groupings if
True. Otherwise all nodes of one group are colored the same. (Respective node color map dict provided by aESTransformerchild)
- Returns:
Graph object visualized.
- Return type:
Example
Setting
spellings.get_from'slogging level to debug for decluttering doctest output:>>> from tessif.frused import configurations >>> configurations.spellings_logging_level = 'debug'
Simulate the omeof standard energy system and draw it:
>>> from tessif.frused.paths import example_dir
>>> from tessif.transform.es2mapping import omf as tomf
>>> from tessif.transform import nxgrph as nxt
>>> from tessif.visualize import nxgrph as nxv
>>> import os
>>> from tessif import simulate
>>> from tessif import parse
>>> es = simulate.omf(
...     path=os.path.join(example_dir, 'data', 'omf',
...                       'xlsx', 'energy_system.xlsx'),
...     parser=parse.xl_like)
>>> formatier = tomf.AllFormatier(es, cgrp='all')
>>> grph = nxt.Graph(tomf.FlowResultier(es))
>>> for key, value in formatier.edge_data()['edge_width'].items():
...    formatier.edge_data()['edge_width'][key] = 4 * value
>>> nxv.draw_graphical_representation(
...     formatier=formatier, colored_by='name')
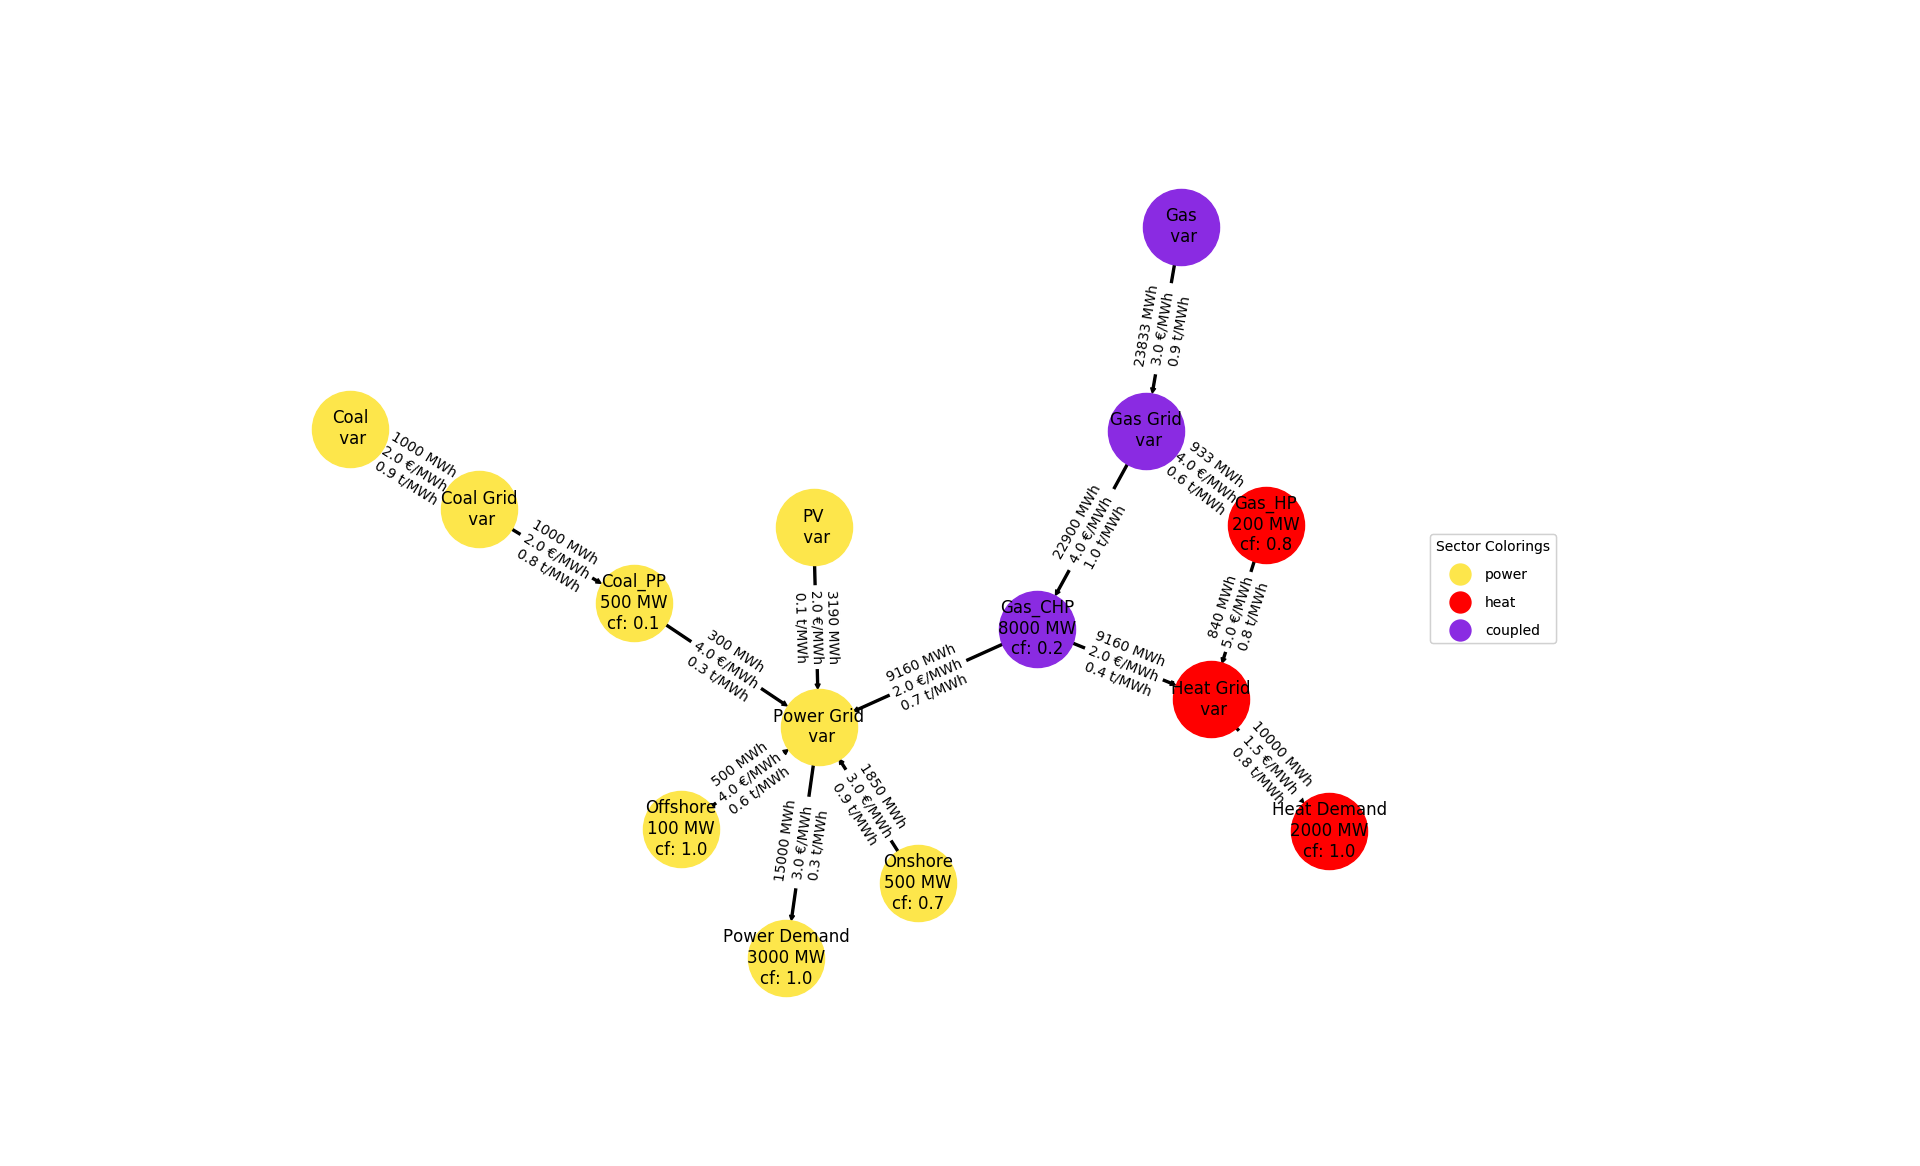
- tessif.visualize.nxgrph.draw_numerical_representation(formatier, colored_by='name', shift_colors=False)[source]
Examplary code for a numerically enhanced energy graph drawing.
Mainly designed as reference on how to exploit the dictionairy aggregating capabilities of
draw_graph()and the convenience of aESTransformerchild when trying to use thedraw()like functions of networkx.Creates a plain
networkx.DiGraphobject only consisting of nodes and edges found informatier.This plain graph is then provided to
draw_graph()with theformatierproviding manually stated key word arguments.This is of course not the design case, because this behaviour could be easily archived only using
draw_graph()while providing anformatierreturning the desired formats when accessed fornode_dataandedge_data. This however assumes we are commited enough to write our ownESTransformerinstead of simply tweaking the hell out of the ones already hard coded via simple keyword arguments.- Parameters:
formatier¶ (
ESTransformer) – Energy system to dictionairy transformer object returning its data as a 2 layer nested dict in the form of{attribute: {node/edge: parameter}}if accessed fornode_data/edge_datarespectively. As well es a default dictionairy for node and edge attributes.colored_by¶ ({'name', 'carrier', 'sector'}, optional) –
Specification on how to group nodes for coloring. (Respective node color dict provided by an
ESTransformerchild)Default implementations are:
’name’: Searches for keywords in str(node.label)
’carrier’: Searches for keywords in node.label.carrier
’sector’: Searches for keywords in node.label.sector
(Refer to
NodeColorGroupingsfor namedtuple implementation)Note
To try out tweaking things your own way, create a custom Formatier class inheriting
ESTransformerand overwrite_map_node_colors()for additional coloring logic.shift_colors¶ (bool, default=False) – Use a colormap cycle for color groupings if
True. Otherwise all nodes of one group are colored the same. (Respective node color map dict provided by anESTransformerchild)
Example
Setting
spellings.get_from'slogging level to debug for decluttering doctest output:>>> from tessif.frused import configurations >>> configurations.spellings_logging_level = 'debug'
Simulate the omeof standard energy system and draw it:
>>> from tessif.frused.paths import example_dir
>>> from tessif.transform.es2mapping import omf as tomf
>>> from tessif.transform import nxgrph as nxt
>>> from tessif.visualize import nxgrph as nxv
>>> import os
>>> from tessif import parse, simulate
>>> es = simulate.omf(
...     path=os.path.join(example_dir, 'data', 'omf',
...                       'xlsx', 'energy_system.xlsx'),
...     parser=parse.xl_like)
>>> formatier = tomf.AllFormatier(es, cgrp='all')
>>> grph = nxt.Graph(tomf.FlowResultier(es))
>>> nxv.draw_numerical_representation(
...     formatier=formatier, colored_by='sector')