ldc
ldc is a powerfull tessif line drawing utility based on
matplotlib.pyplot.plot().
Designed to quickly draw arbitrarily complex sets of load duration curves.
Algorithm is build on a triple nested list engine which is able to visualize
plot data grouped as [categroy [subcategory [data]]]
Default coloring uses tessif.frused.themes.colors and
cmaps.
- tessif.visualize.ldc.plot(loads, category_labels=[], category_colors=[], subcat_labels=[], subcat_colors=[], load_label='Load in', load_unit='MW', time_label='Cumulated time period in', time_unit='hours', title='Load duration curves', integer_ticks=True, **kwargs)[source]
Draws a sophisticated bar plot for visualizing energy system load data.
Works on a simple yet powerfull nested list engine. Able to automatically draw a simple bar chart or a full fledged energy system load analysis split by major and minor categorization options. Minor categorization uses triple nested lists, whereas major parameters are represented as double layer nested lists. See parameters for details. Calls
matplotlib.pyplot.bar().- Parameters:
Iterable of numbers i.e.
list,pandas.Seriesorpandas.DataFrameetc. To be plotted data will be transformed into a triple nested list as:[ # Category Level [ # Subcategory Level [ # Data Level ] ] ]
Upper most level:
[Sector 1, …, Sector N]
In between:
[Sbucategory 1, …, Subcategory N] for each category
Lowest level:
[Load at time step 1, …. load at time step N] for each subcategory
Any nesting depth <= 3 can be handled and will be interpreted as stated above
category_labels¶ (
Iterable, default=[]) –Iterable container of strings used to label category level entries. i.e.:
['Power', 'Heat', 'Mobility']Beware:
len(category_labels)!>= number of categoriesUse
Noneto not draw any major labels.Use default to tag the n-th category by ‘Category N’
category_colors¶ (
Iterable, default=[]) –Iterable container of color strings used to color major categories when drawing the major category plot. i.e.:
['yellow', 'red' 'blue']Beware:
len(category_colors)!>= number of categoriesUse
Noneto use matplotlib’s default coloring cycle.Use
[](default) to invoke thetessif.frused.themes.colorscoloring.
subcat_labels¶ (
Iterable, default=[]) –iterable container of strings used to tag subcategory level entries. i.e :
[['PV', 'Wind'], ['Gas', 'ST'], ['Diesel', 'Petrol']]Nest entries intuitively the way the loads are nested.Beware:
len(labels)!>= number of categorieslen(nested_labels)!>= number of respective subcategory entriesUse
Noneto not tag any subcategory level entriesUse
[](default) to tag the n-th subcategory entry by ‘Subcategory N’
subcat_colors¶ (
Iterable, default=[]) –iterable container of strings used to color subcategory level entries. i.e:
[['yellow' , '#123456'], ['red', 'crimson'], ['pink', 'black']]Nest entries intuitively the way the loads are nested.Beware:
len(colors)!>= number of categorieslen(nested_colors)!>= number of respective subcategoriesUse
Noneto use matplotlib’s default coloring cycle.Use
[](default) to invoke thetessif.frused.themes.cmapscoloring.
load_label¶ (str, default='Load in') – First part of the y label.
load_unit¶ (str, default ='MW') – Second part of the y label
time_label¶ (str, default='Cumulated time period in') – First part of the x label
time_unit¶ (str, default='hours') – Second part of the x label
title¶ (str ='Load duration curves') – Title displayed on the very top
integer_ticks¶ (bool, default=True) – Axes tick switch. If
Truethere will only be integer ticks on both axis.kwargs¶ – kwargs are passed to
matplotlib.pyplot.subplots()Use them for sharing x and y axes for example.
Notes
When using the list engine to categorize load duration curves, be aware that the upper most load duration curve is the sum of all load duration curves in that category.
Examples
>>> import matplotlib.pyplot as plt
>>> import tessif.visualize.ldc as ldc
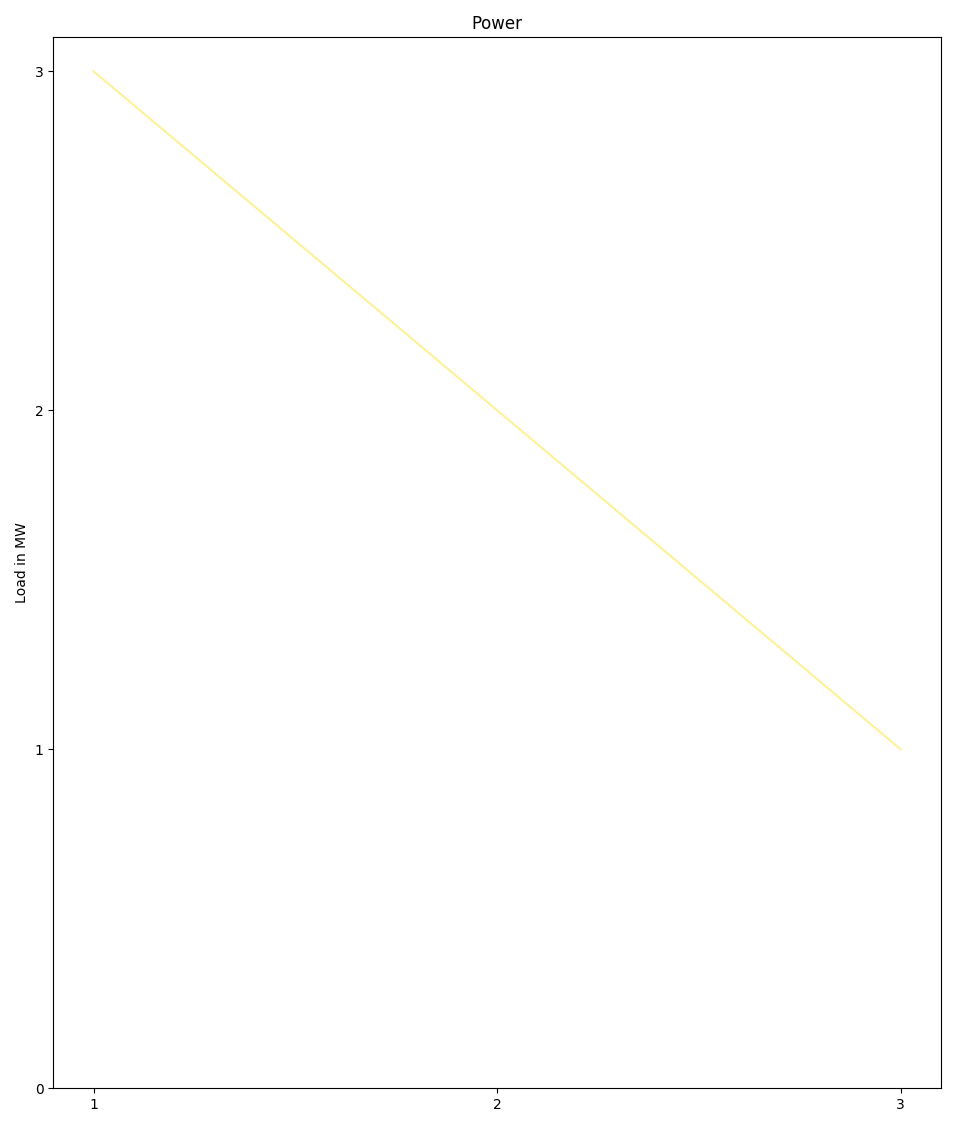
Creating the most simple load duration curve examplifying:
Using
plot()as simple laod duration curve plotterNoneusage to supress featuresOmitting the outer iterable on the optional parameters
Using
kwargsto modify call tomatplotlib.pyplot.subplots()
>>> ldc.plot(
...     loads=[1,2,3],  # one load series
...     subcat_labels=None,   # None to supress feature
...     category_labels='Power',  # Omitting outer iterable
...     tight_layout=True)  # using **kwargs to ask for tight layout
Creating a ldc plot with 2 subcategories of the same category:
>>> ldc.plot(
...     loads=[[1, 2, 3], [3, 2, 1]],  # 1 cat of 2 subcats of 3 laods each
...     subcat_labels=['PV', 'Wind'],   # 2 subcats, 2 labels
...     category_labels='Power',  # Omitting outer iterable
...     tight_layout=True)  # using kwargs to ask for tight layout

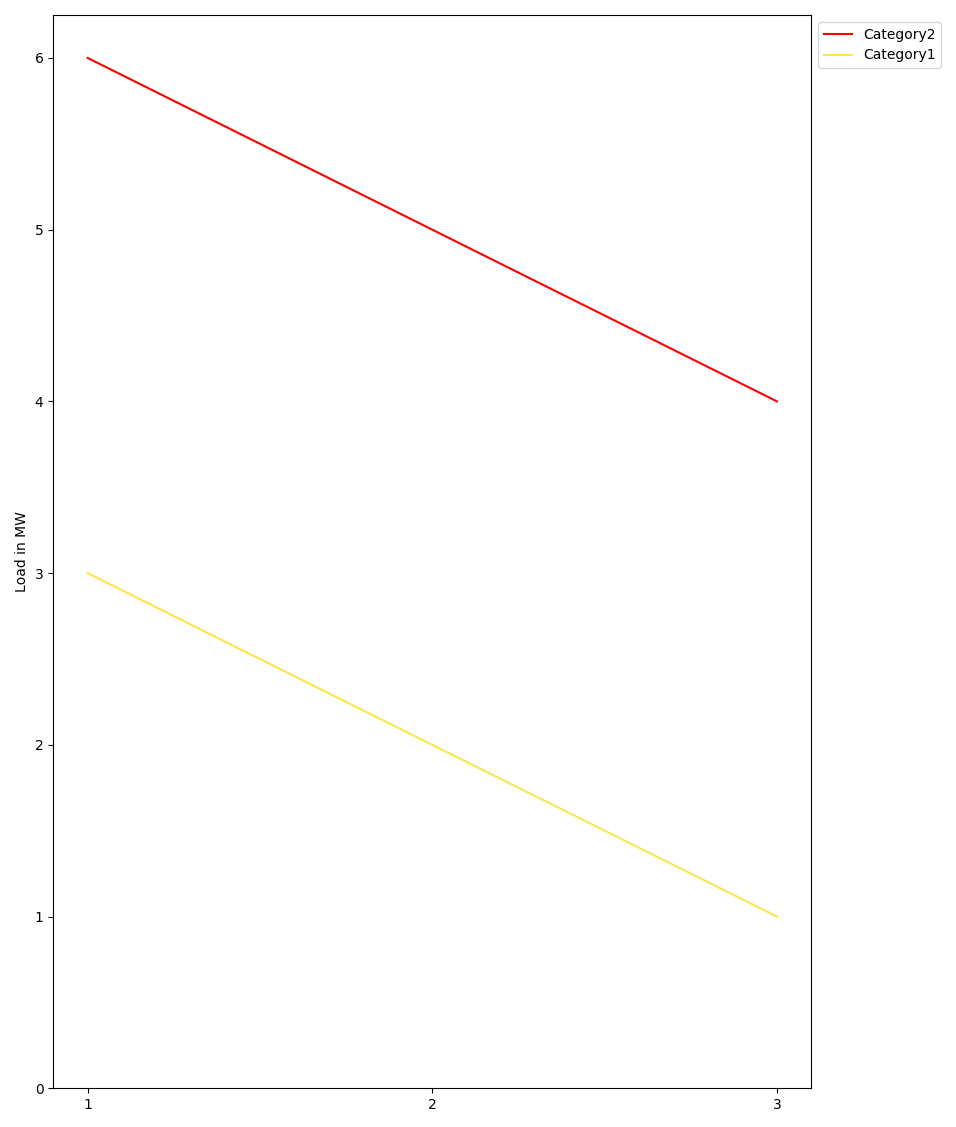
Creating a ldc plot with 2 categories of 1 subcategory each:
>>> ldc.plot(
...     loads=[[[1, 2, 3]], [[4, 5, 6]]],  # 2 cats 1 subcat each
...     # Beware of appropriate nesting when not using all levels:
...     subcat_labels=[['Power'], ['Heat']],
...     # Use default (empty list) to tag loads by 'Category N'
...     category_labels=[],
...     sharex=True,  # using kwargs to share x axis
...     tight_layout=True)  # and ask for tight layout
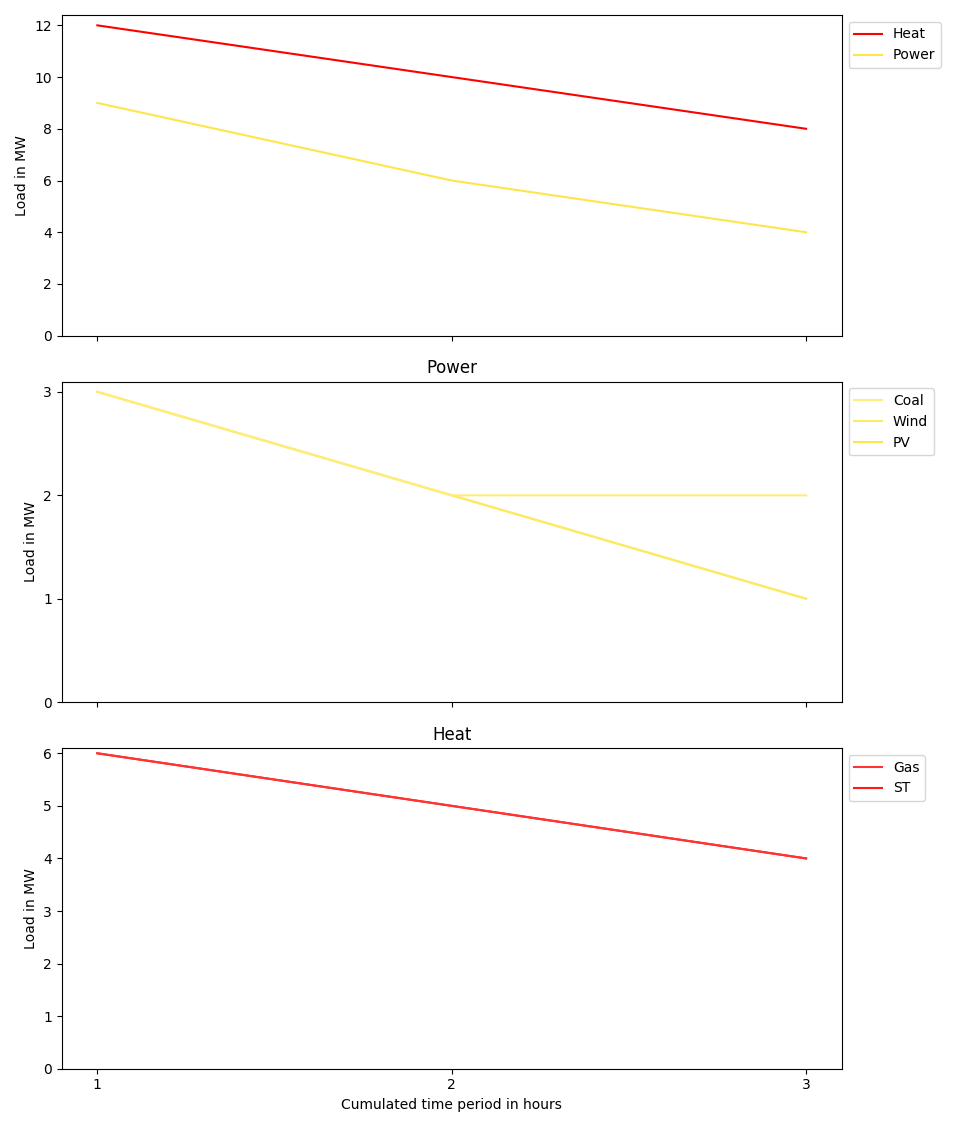
Creating an energy system load duration curve analysis plot with 2 categories of 3/2 subcategories:
>>> ldc.plot(
...     loads=[[[1, 2, 3], [3, 2, 1], [3, 2, 2]],
...           [[4, 5, 6], [6, 5, 4]]],
...     # labels are nested intuitively
...     subcat_labels=[['PV', 'Wind', 'Coal'], ['ST', 'Gas', ]],
...     # All kinds of iterables are supported:
...     category_labels=('Power', 'Heat'),
...     sharex=True,  # using kwargs to share x axis
...     tight_layout=True)  # and ask for tight layout
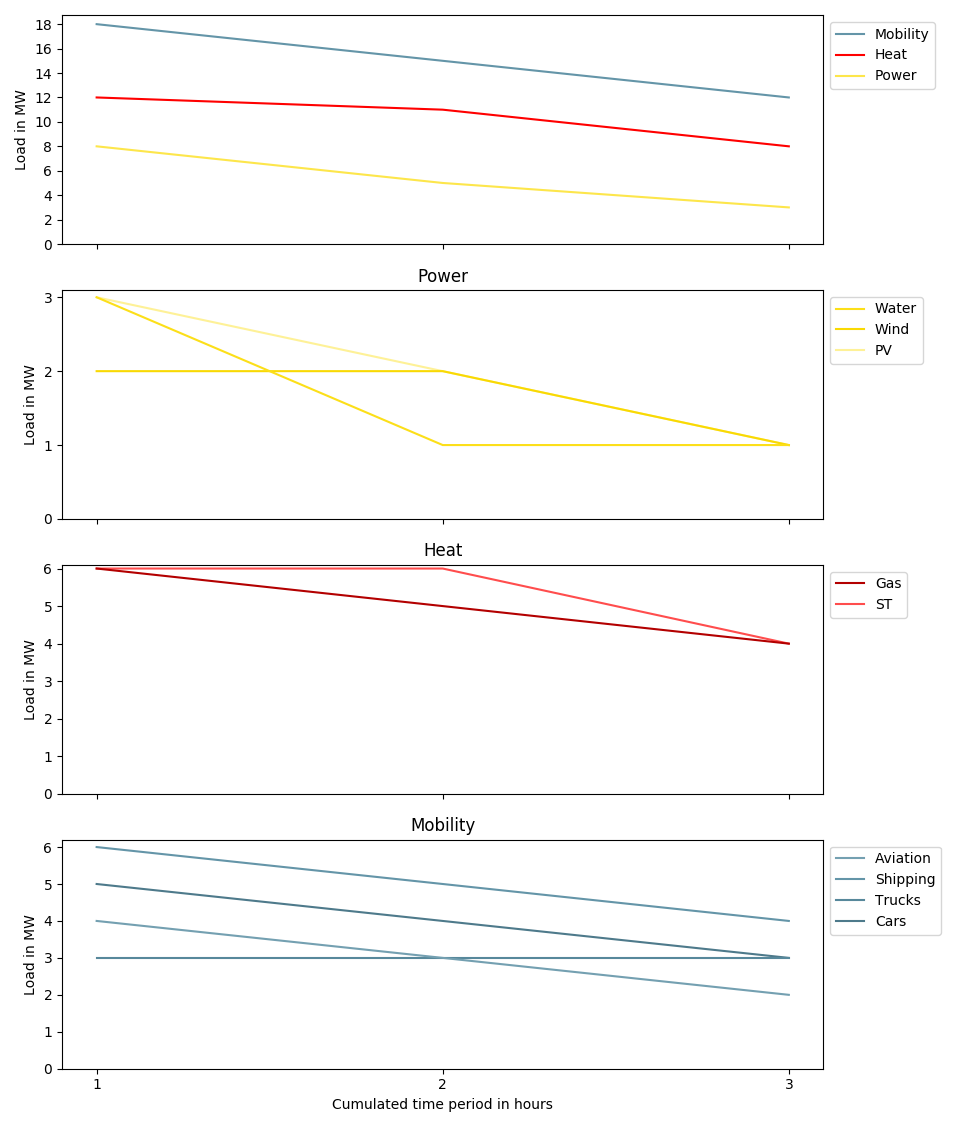
Creating an energy system load duration curve analysis plot - Design Case:
>>> ldc.plot(
...     # 3 cats, 3/2/4 subs
...     loads=[[[1, 2, 3], [2, 2, 1], [3, 1, 1]],
...            [[4, 6, 6], [6, 5, 4]],
...            [[3, 4, 5], [3, 3, 3], [4, 5, 6], [4, 2, 3]]],
...     # Varying subcat lengths
...     subcat_labels=[['PV', 'Wind', 'Water'], ['ST', 'Gas'],
...             ['Cars', 'Trucks', 'Shipping', 'Aviation']],
...     # All kinds of iterables are supported:
...     category_labels=('Power', 'Heat', 'Mobility'),
...     sharex=True,  # using kwargs to share x axis
...     tight_layout=True)  # and ask for tight layout