Preliminary Result Analysis
The preliminary result analysis is best suited for small to medium size supply system models (up to about 30 to 40 components). Since it serves both purposes at once, doing the actual result analysis and allowing some straight forwared comparisons. Following subsections give an overview of the conducted preliminary result analysis. Amining at demonstrating the method itself as well as selecting specific aspects for further Comparative Result Analysis.
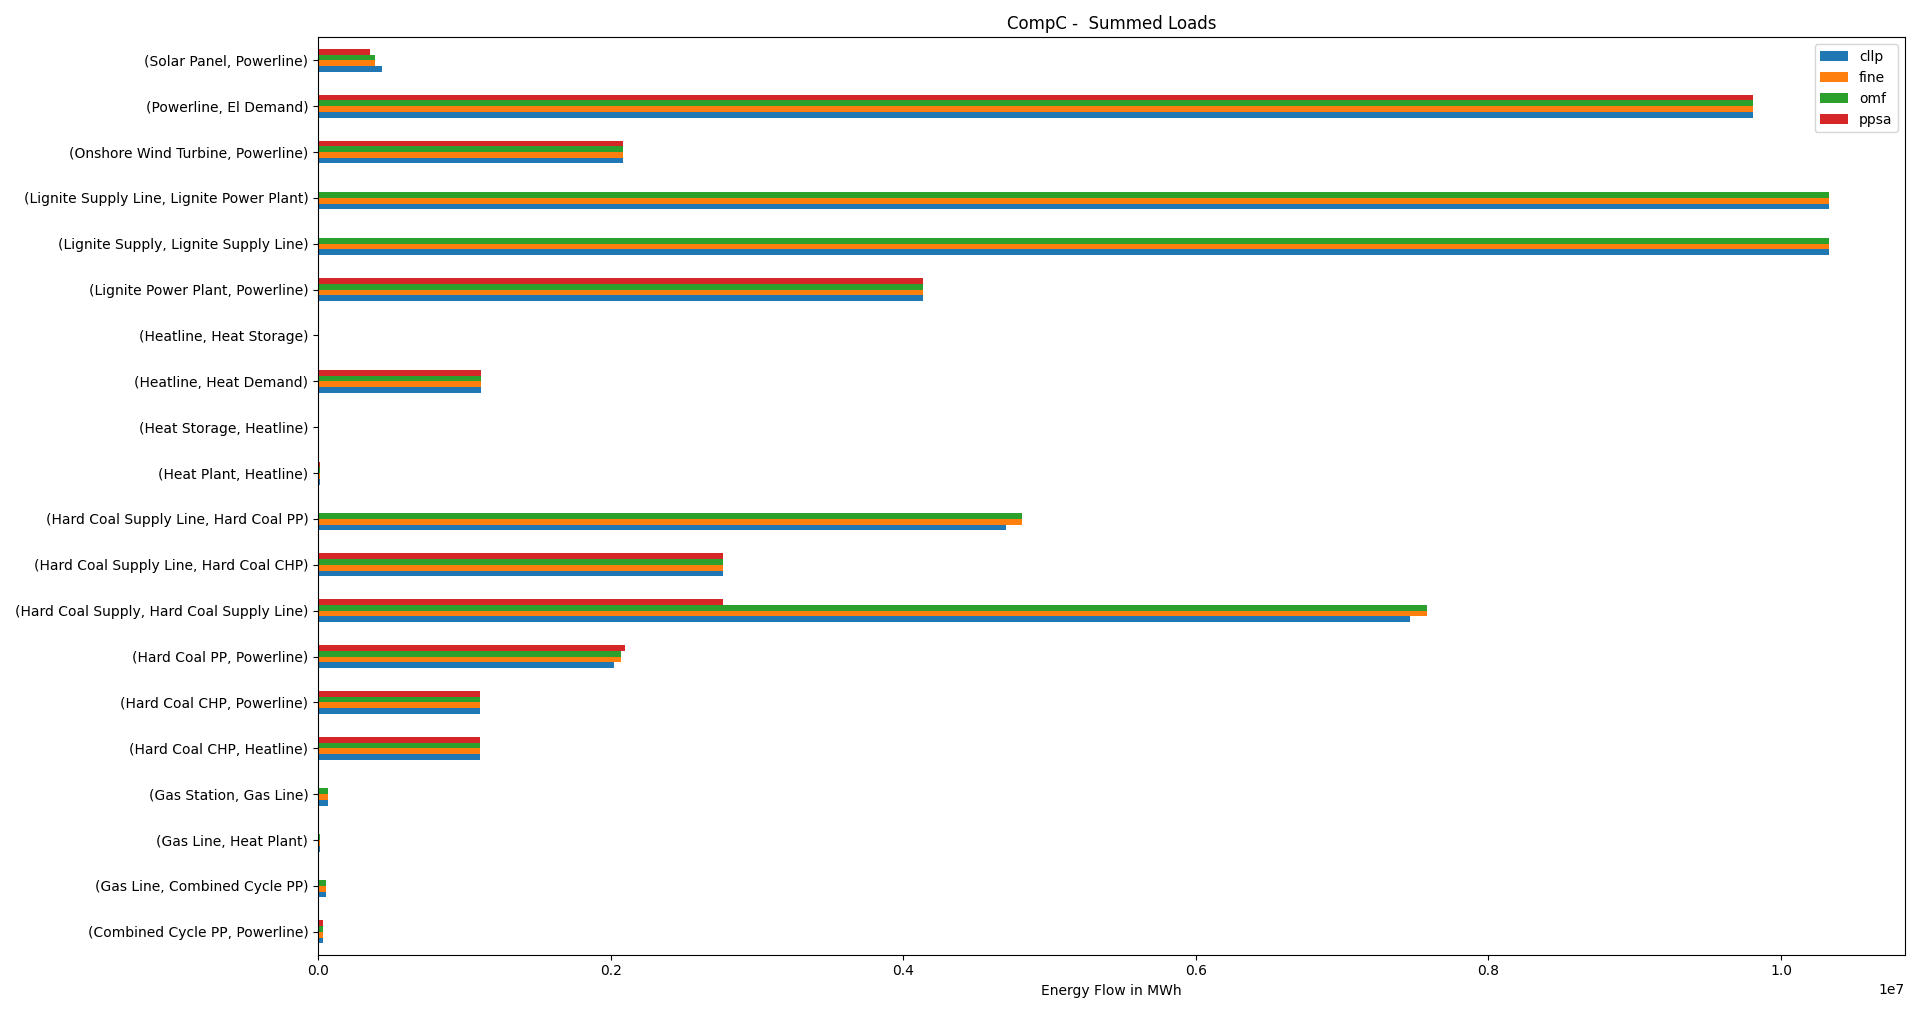
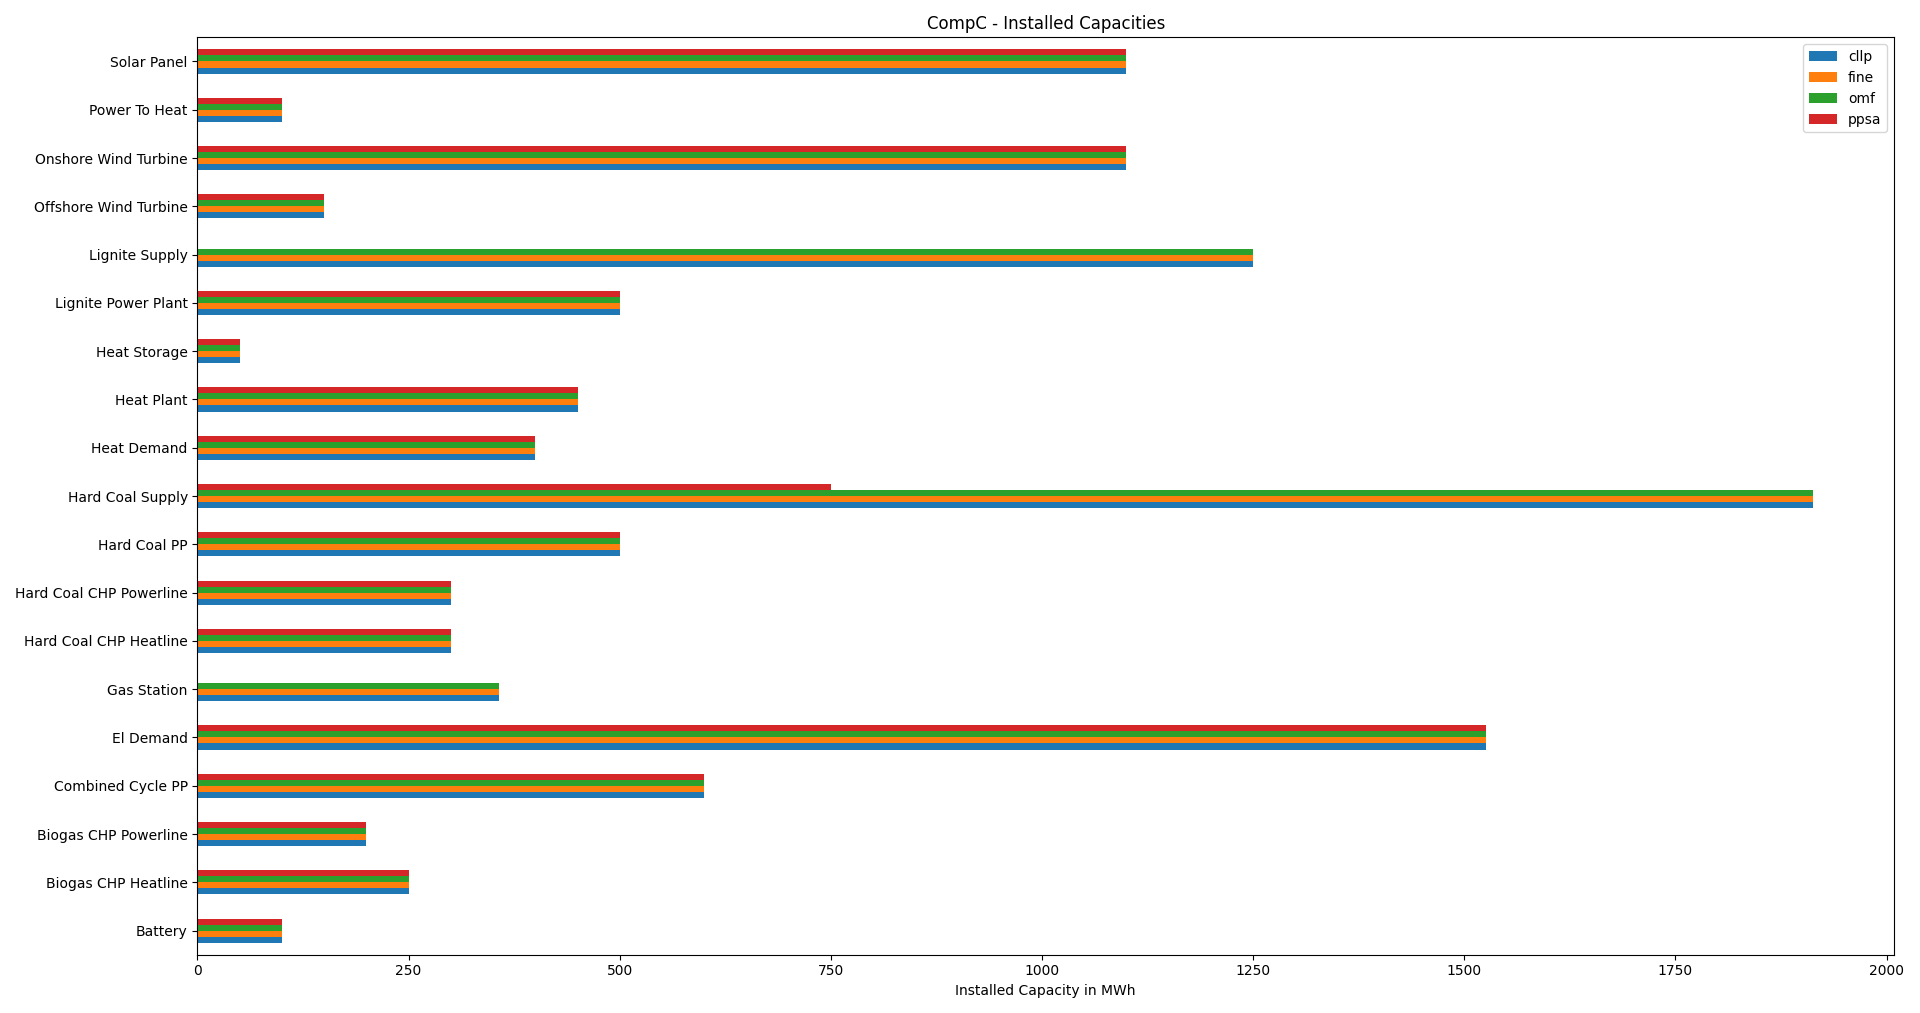
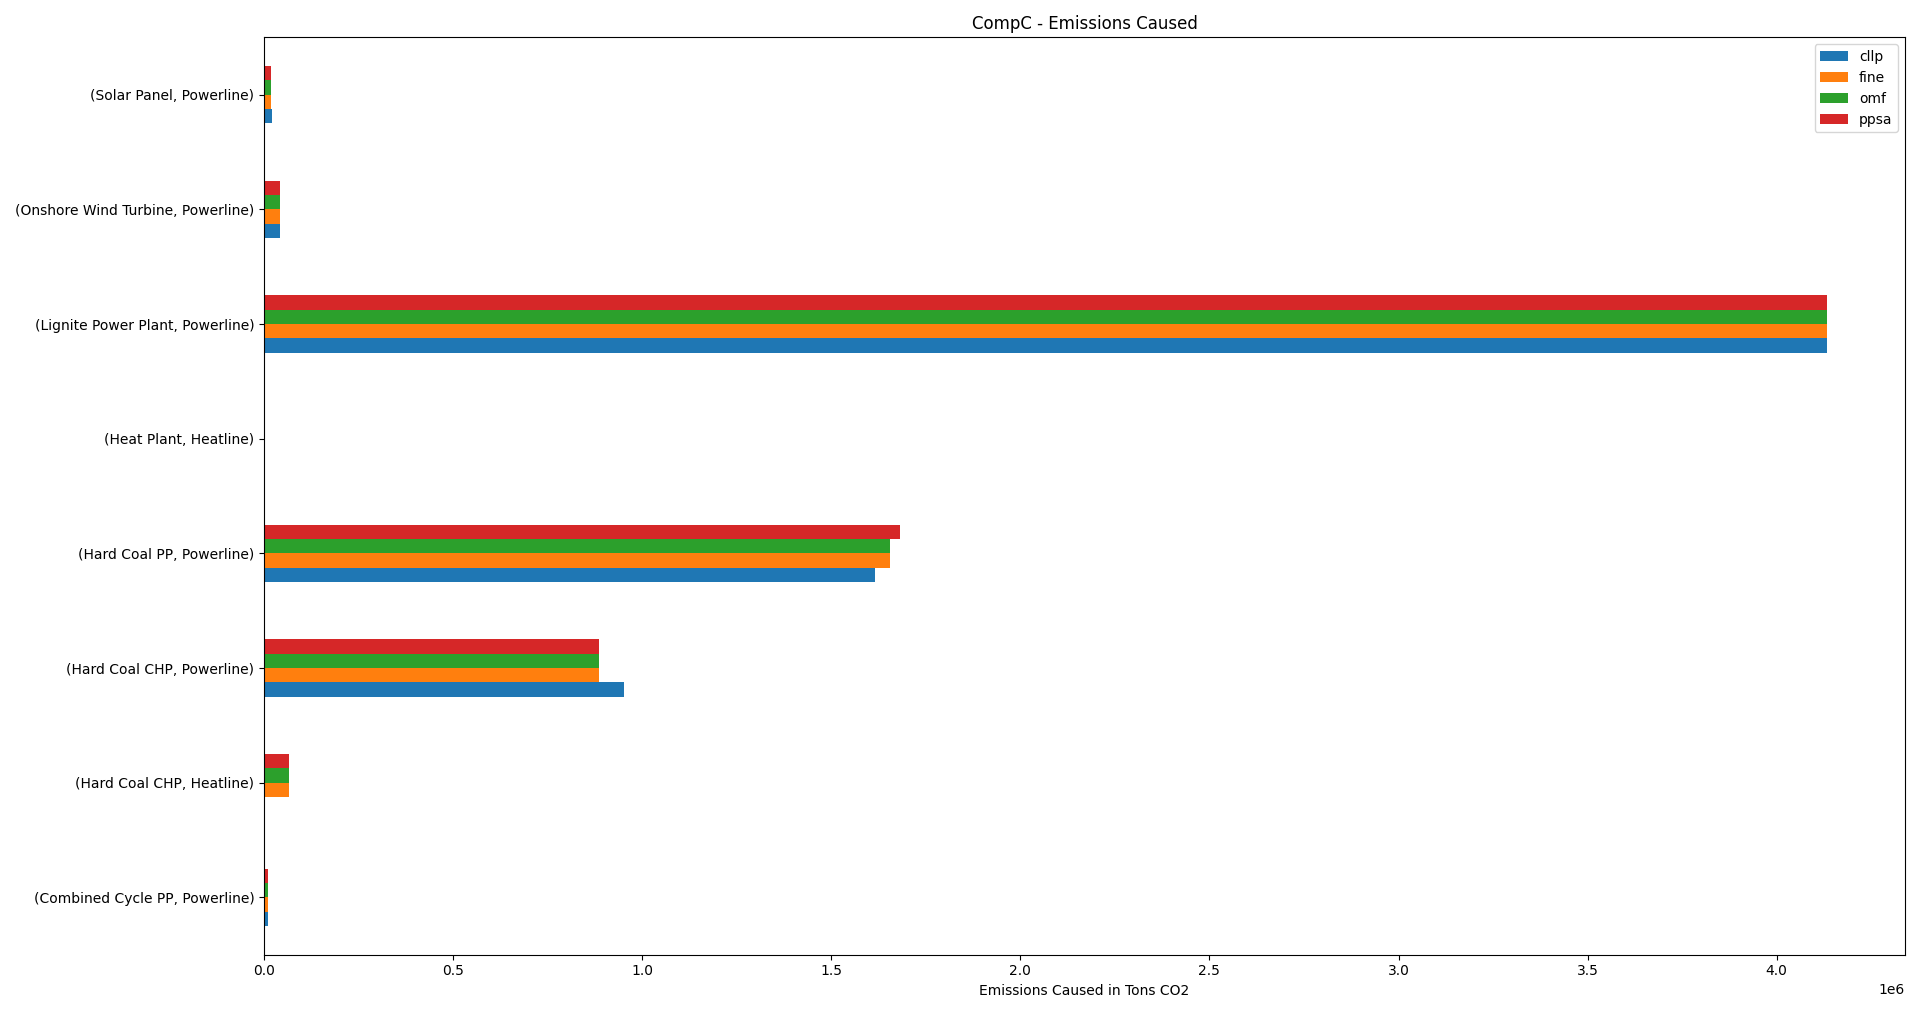
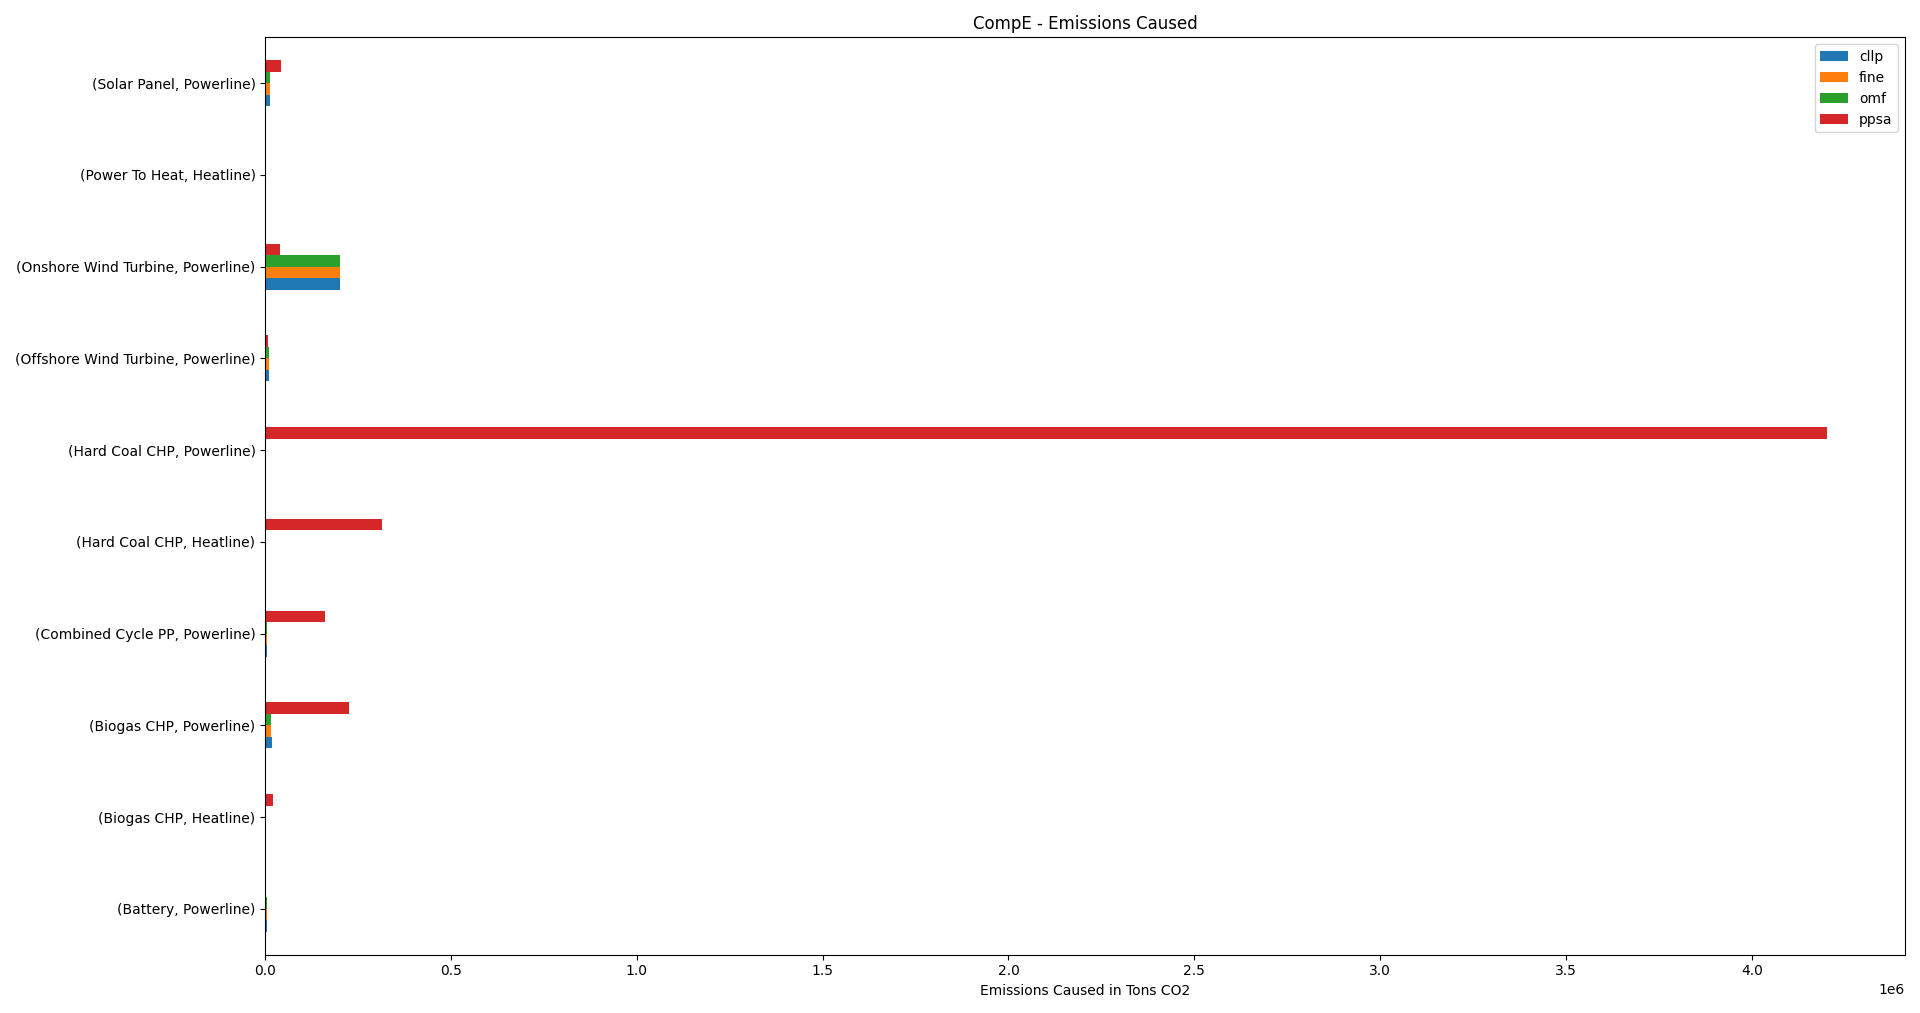
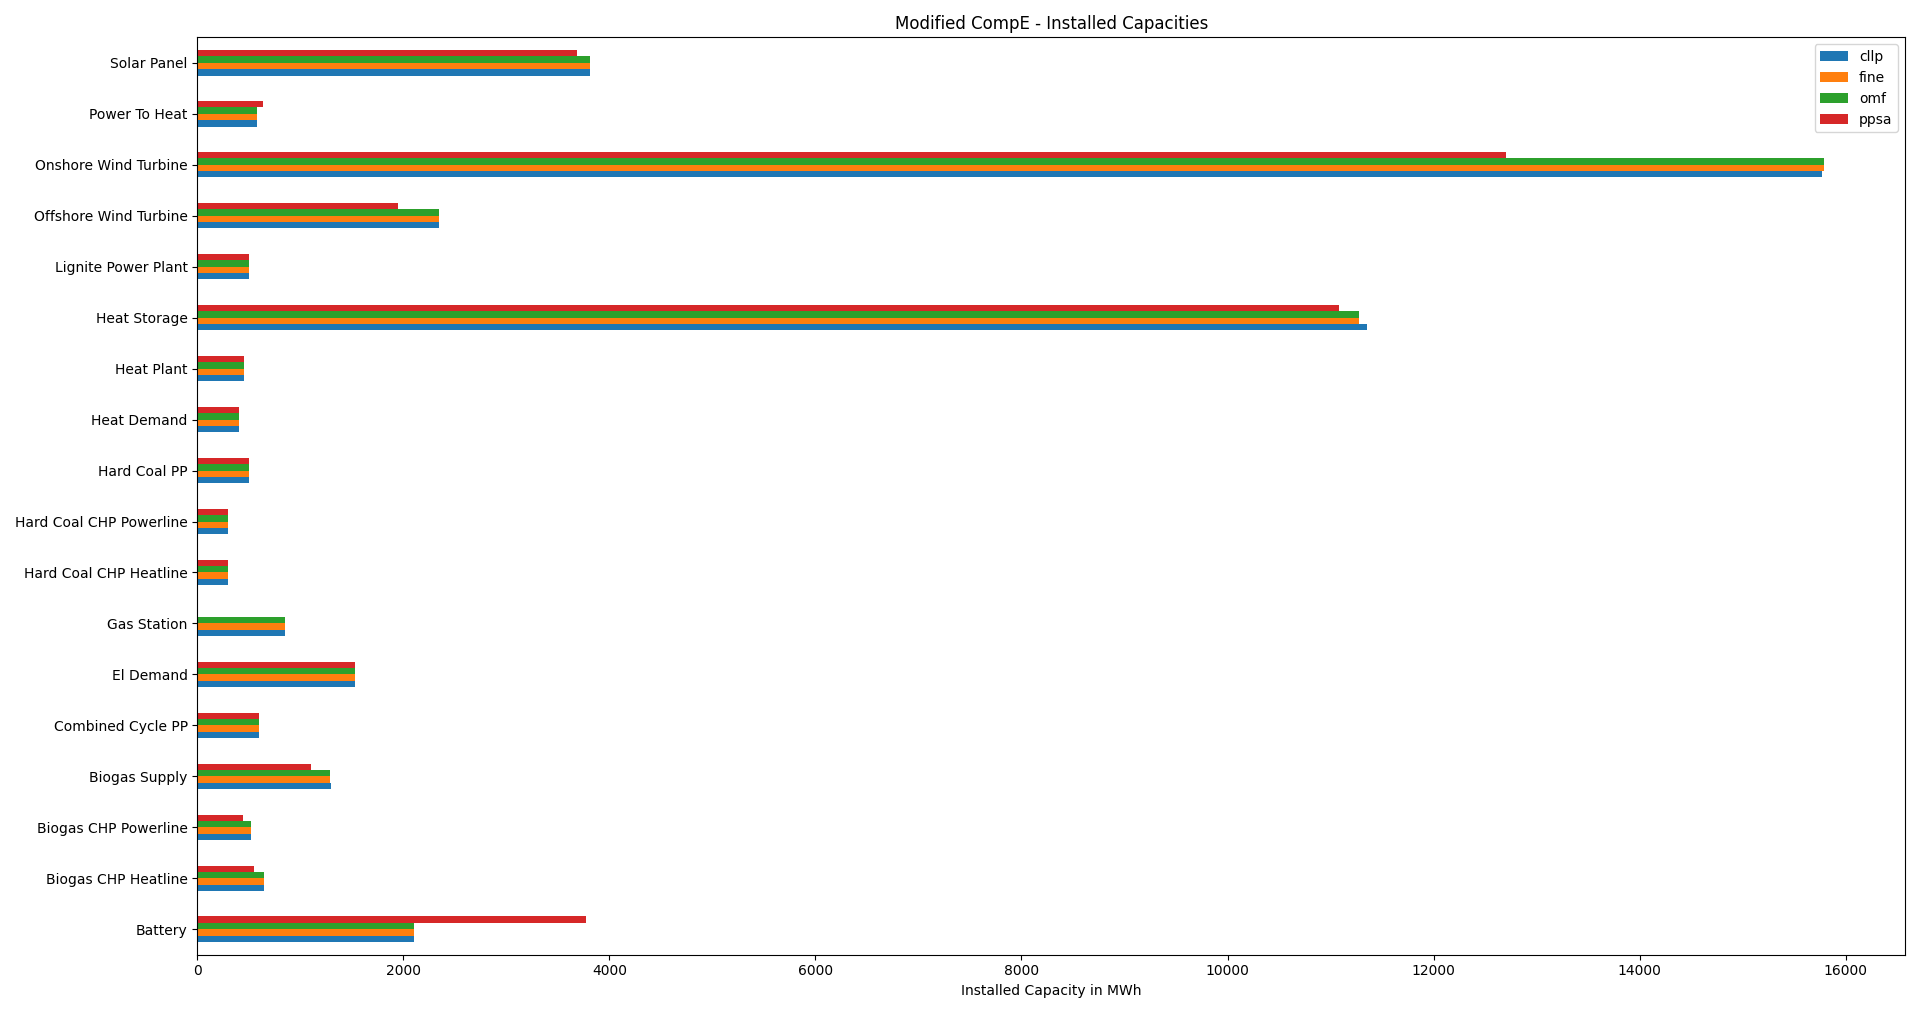
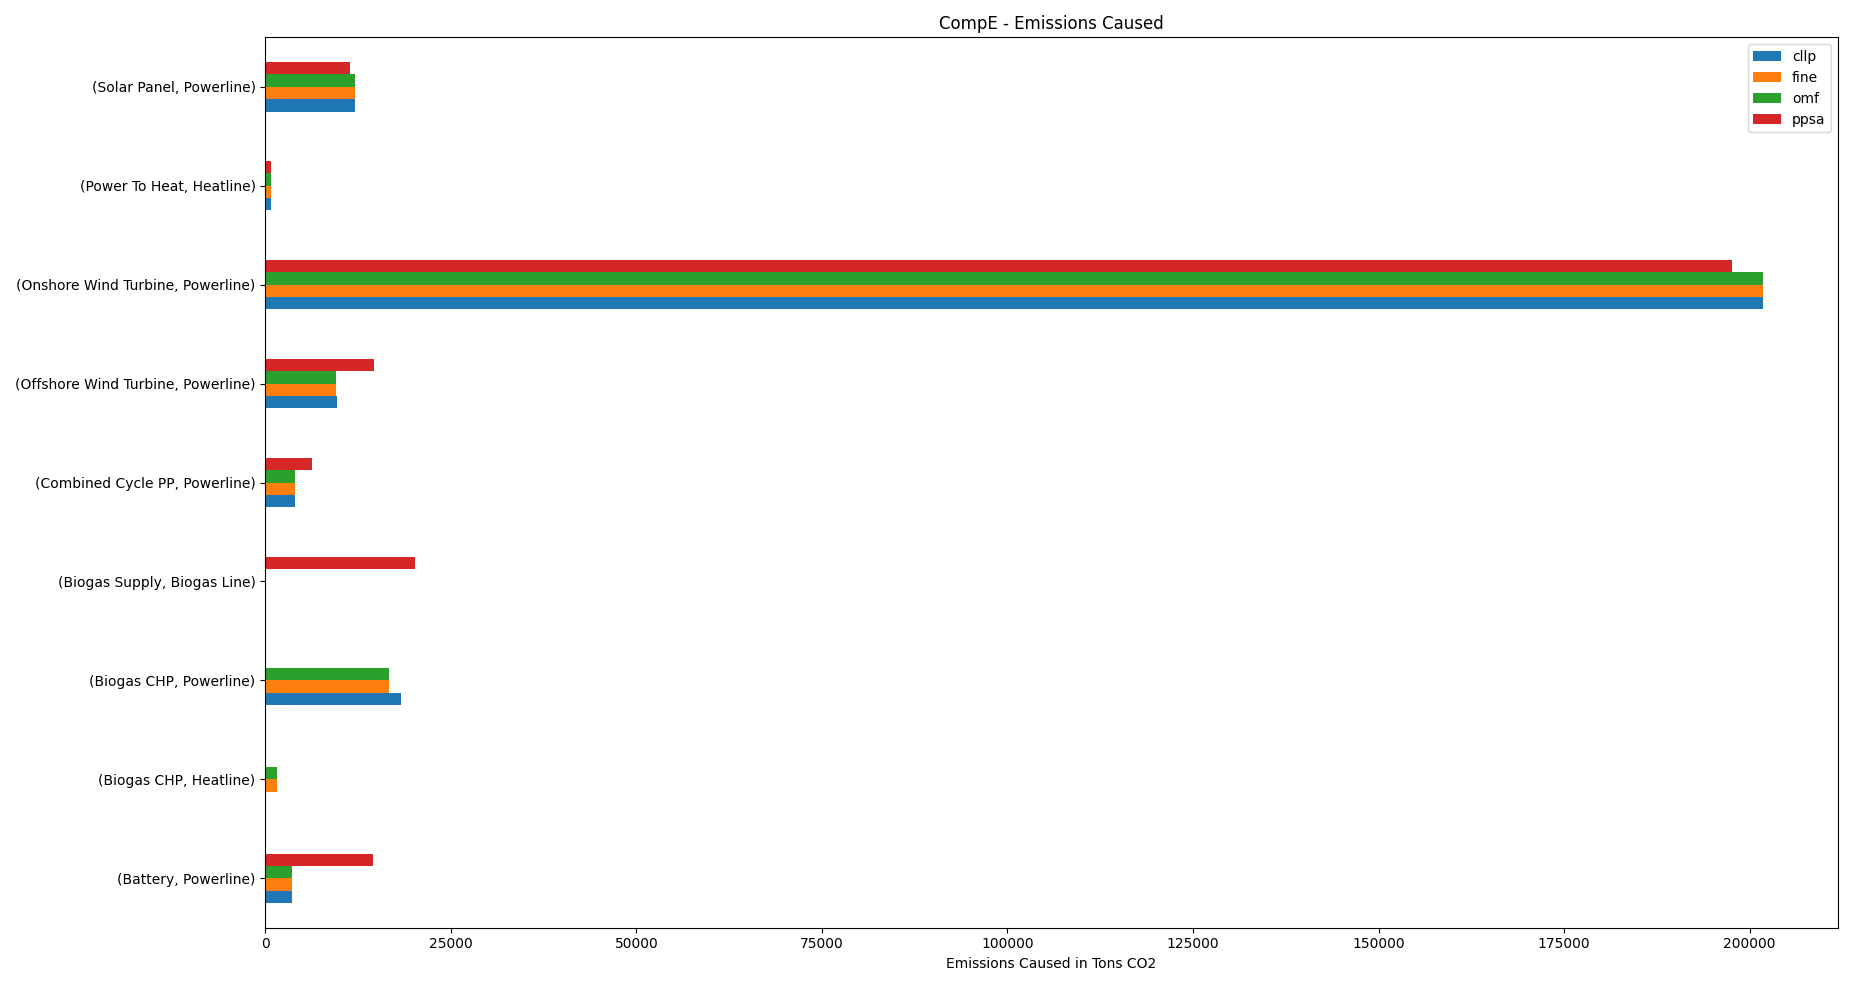
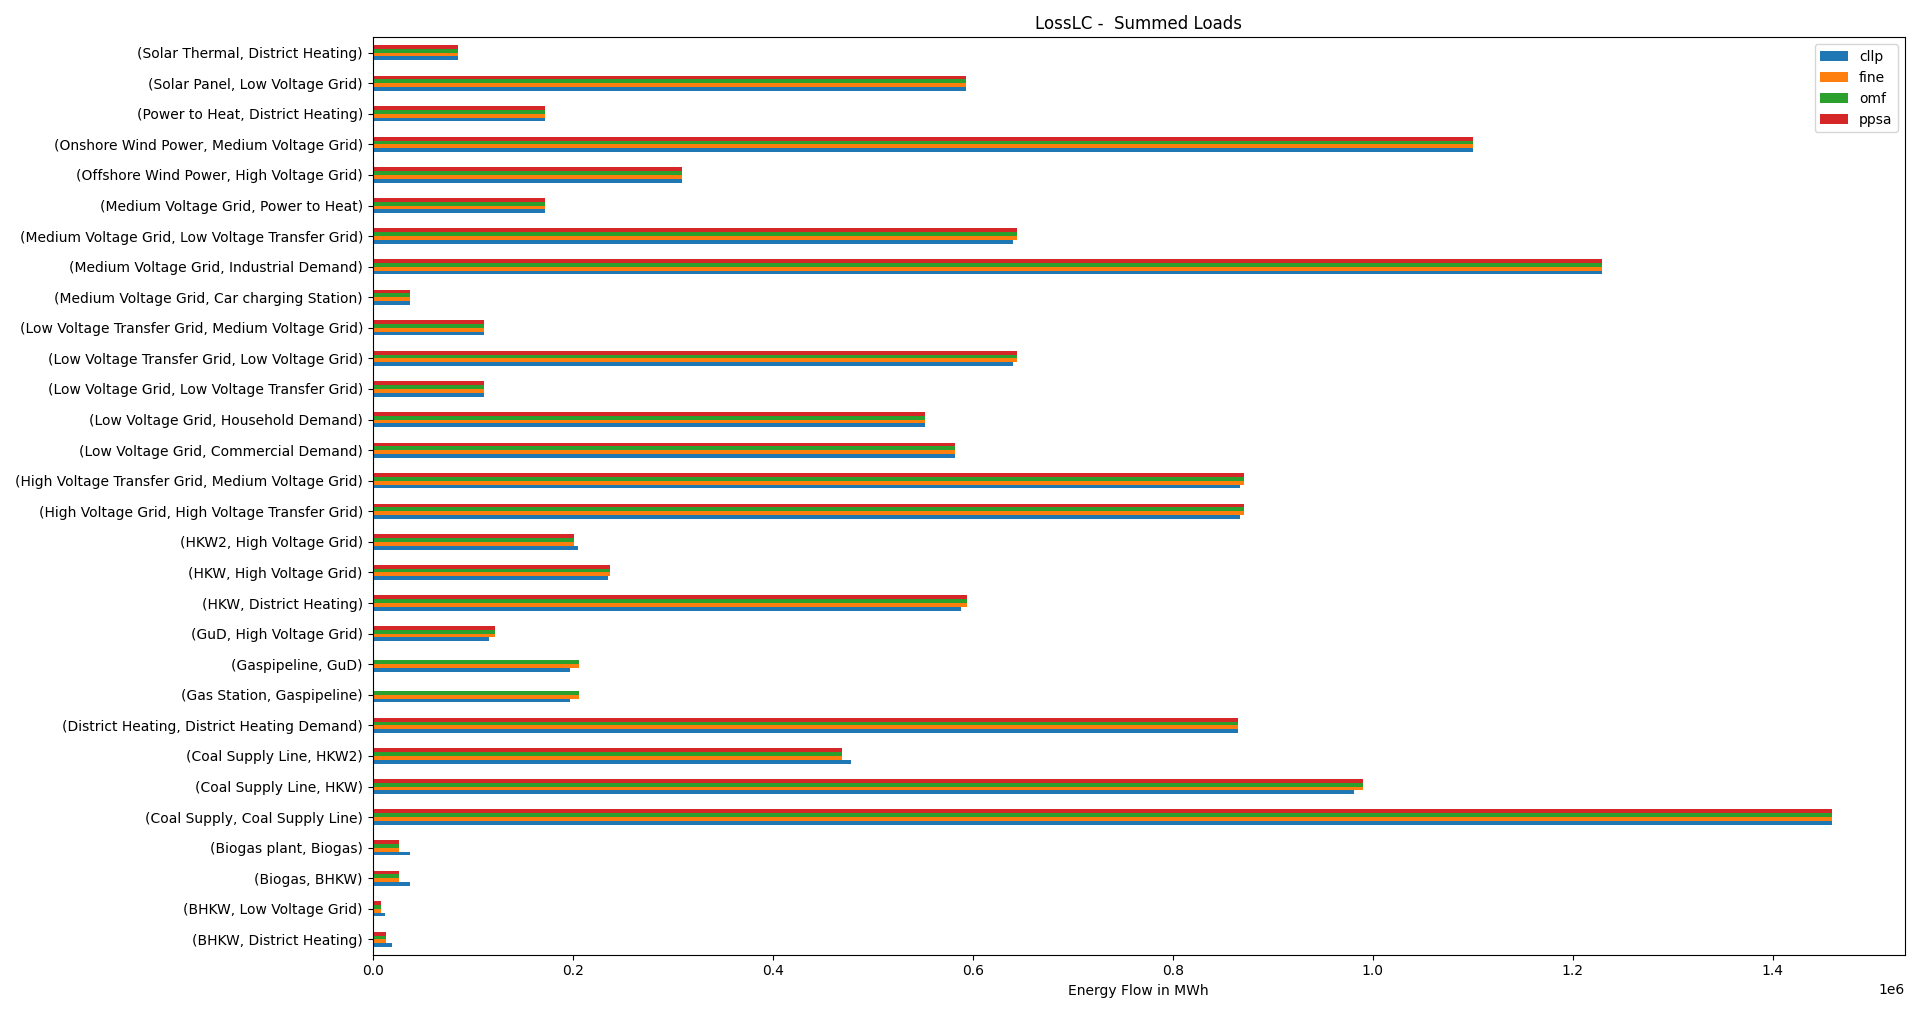
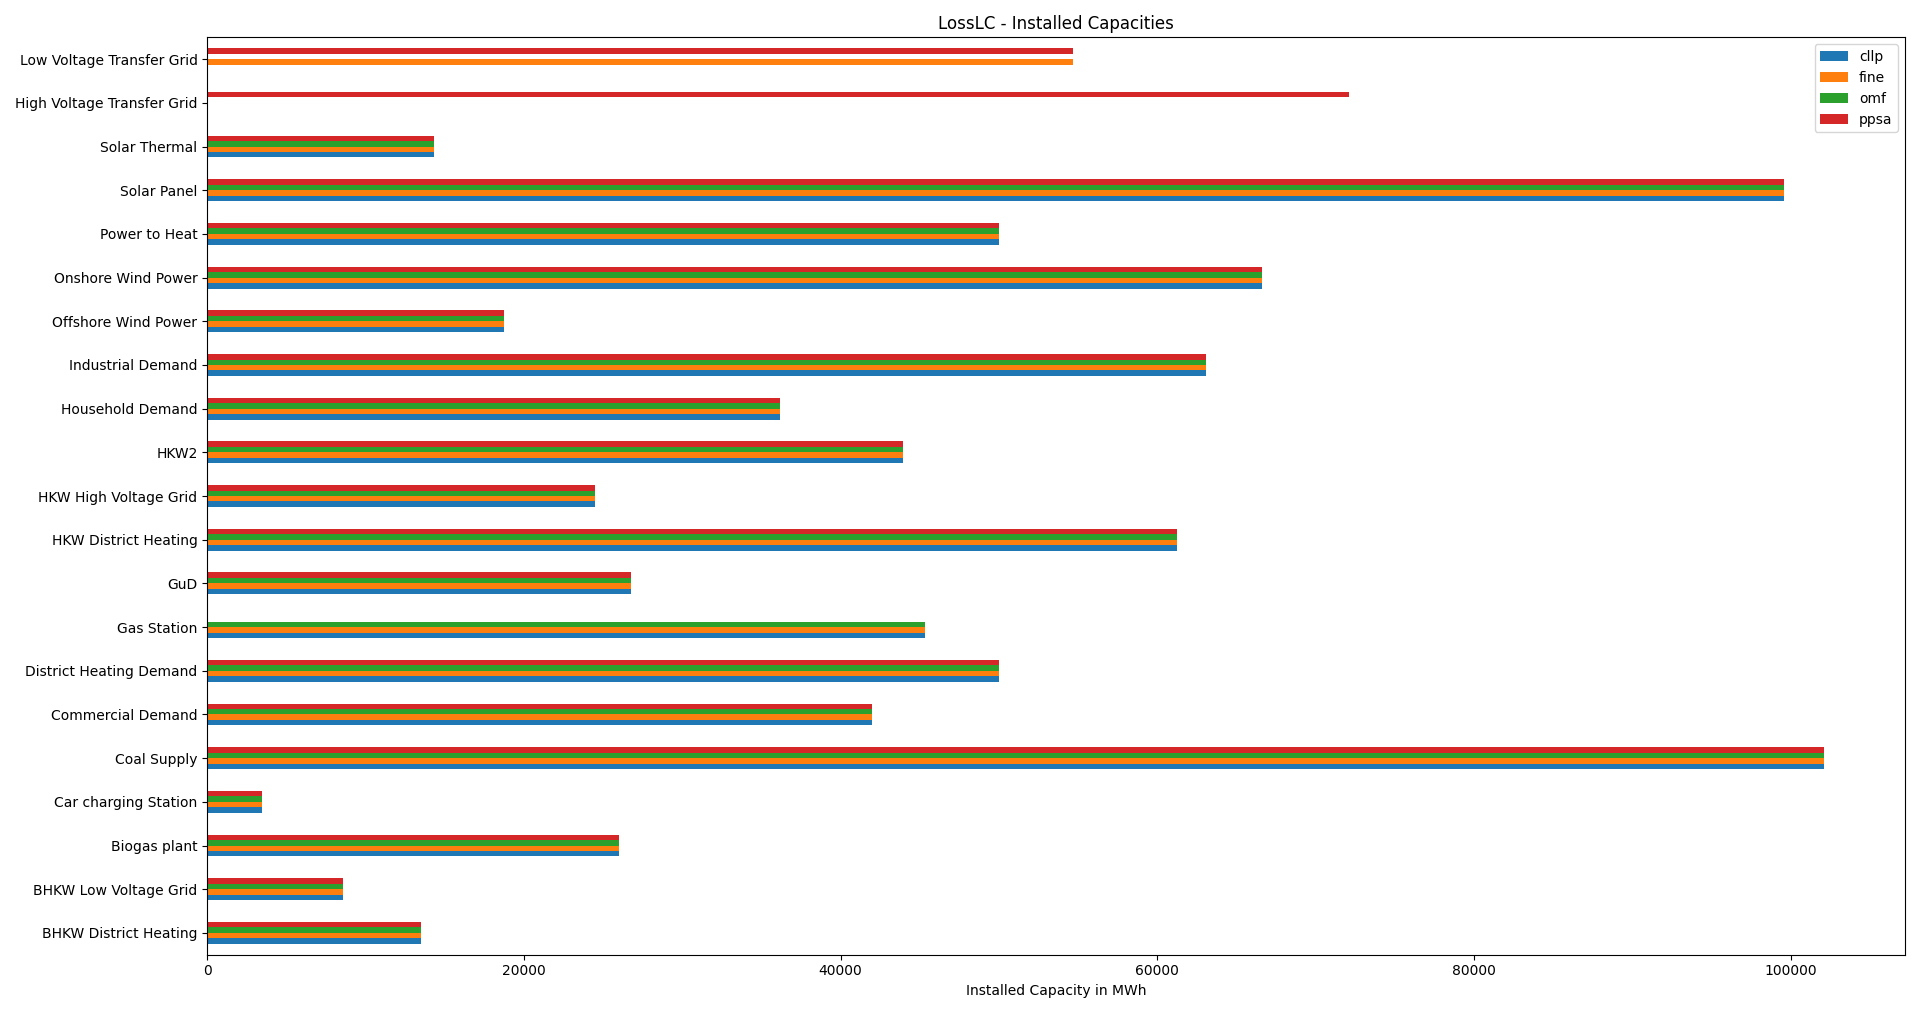
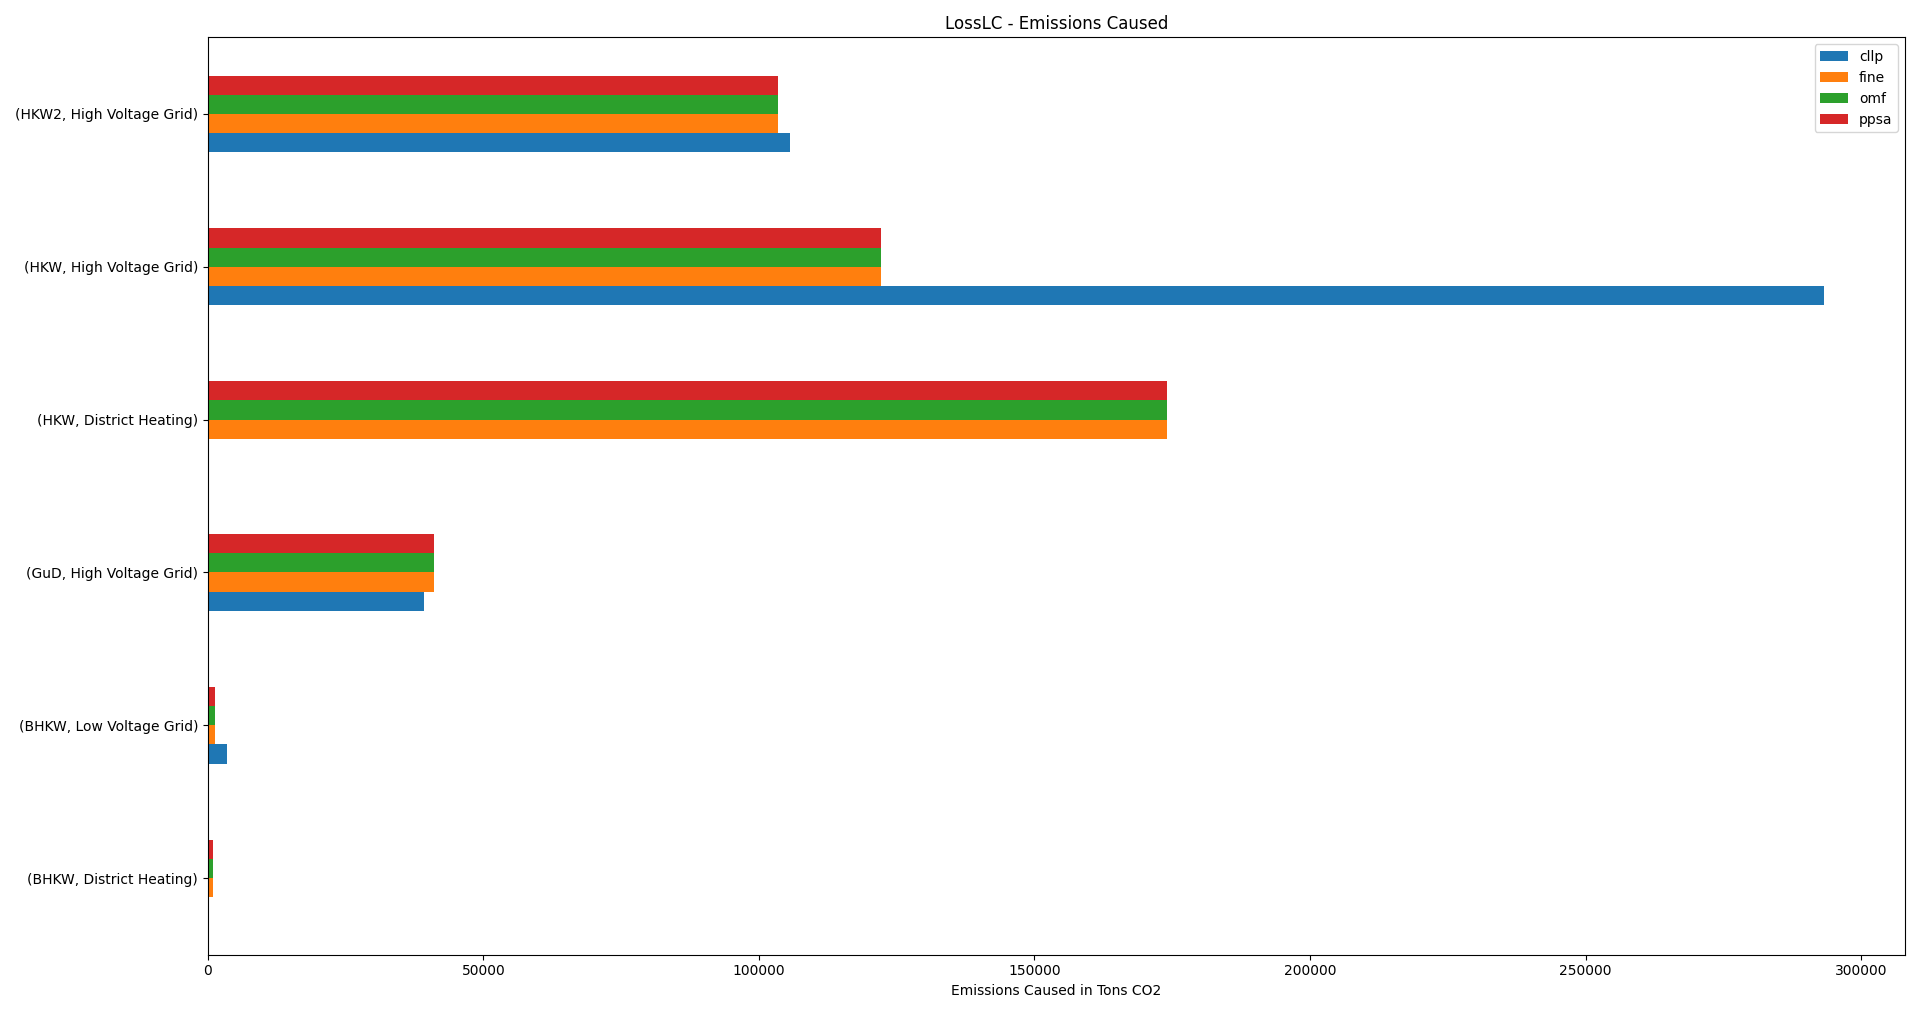
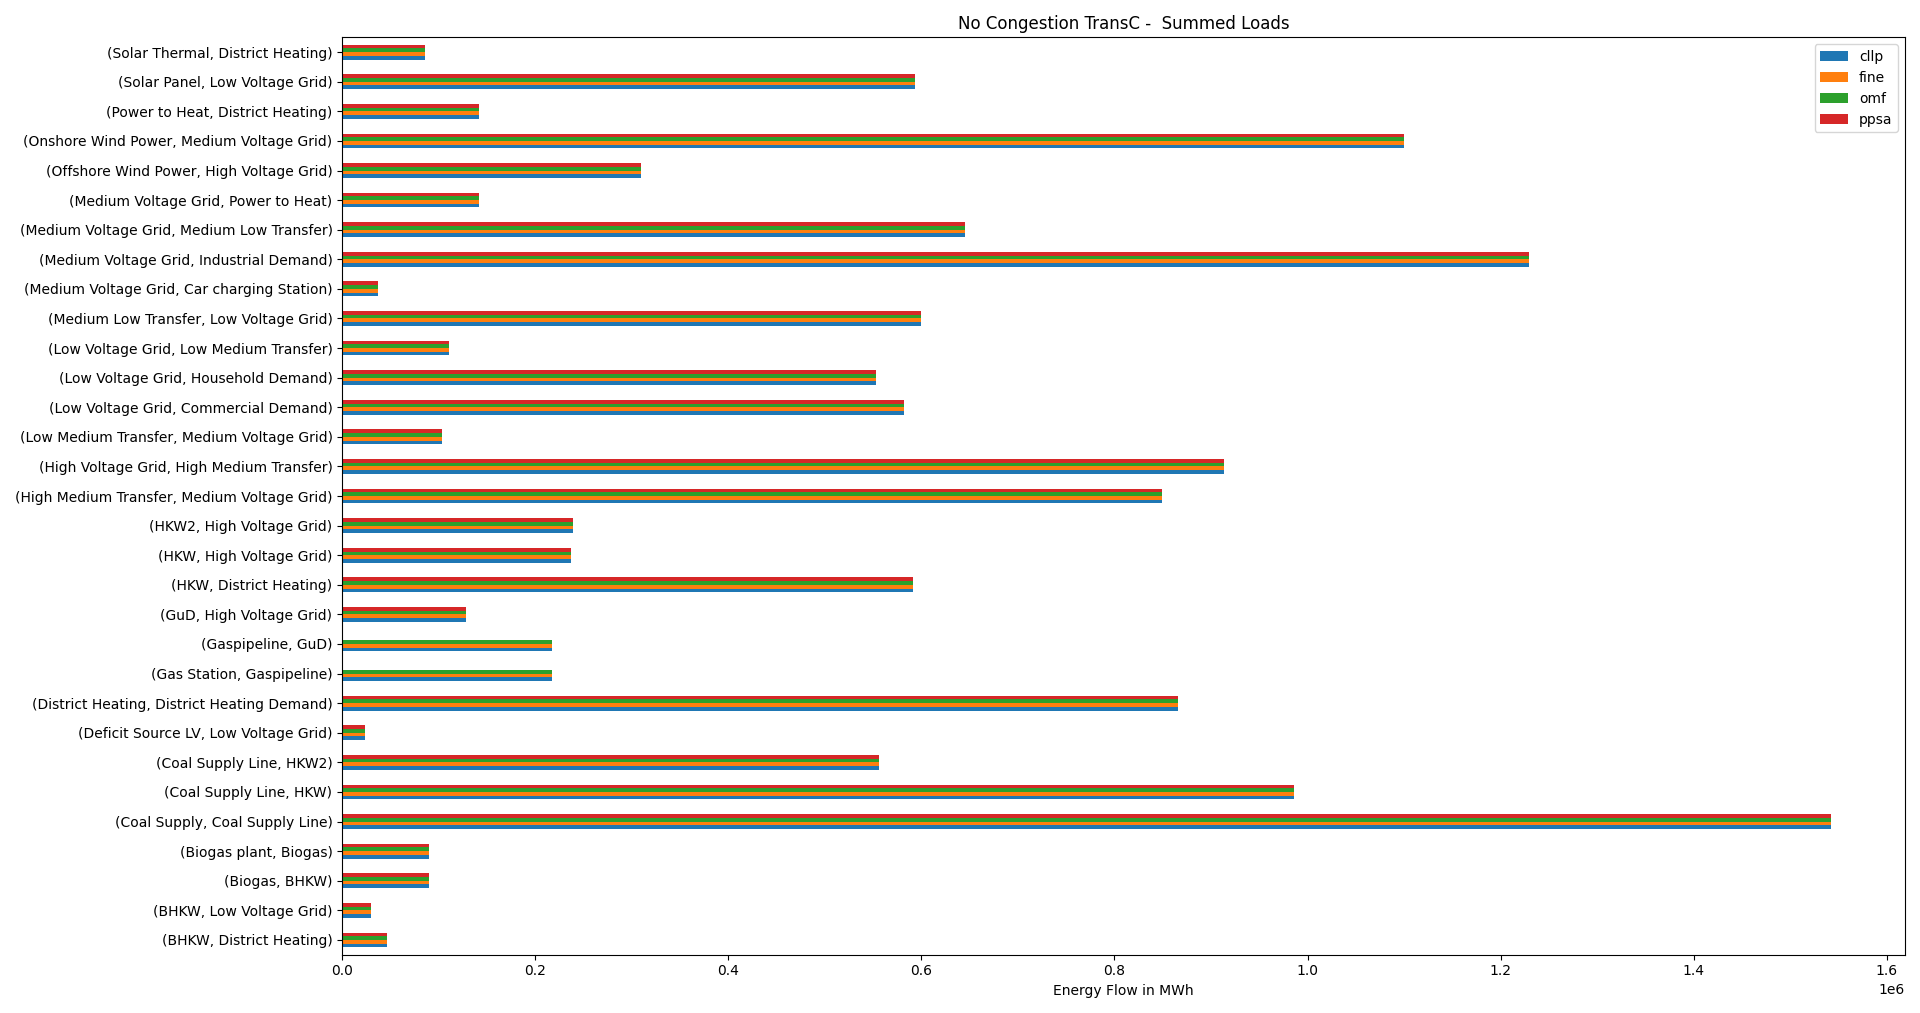
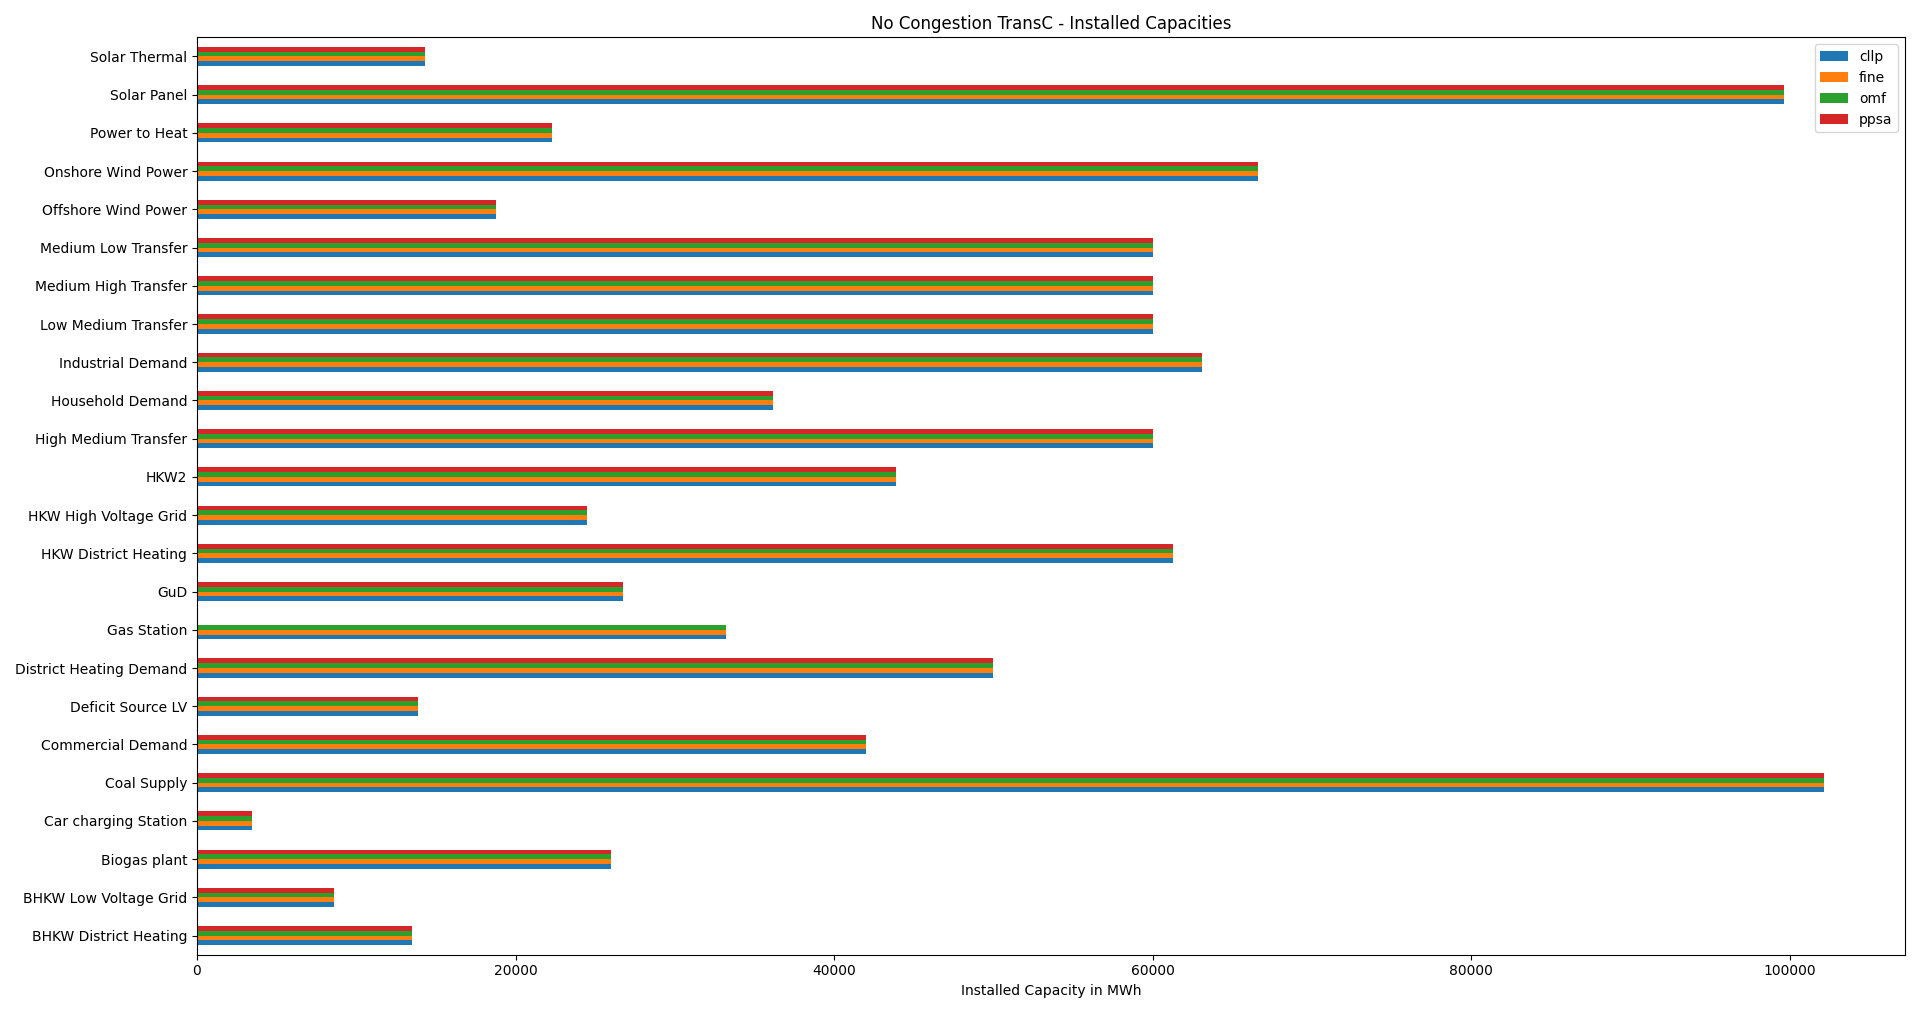
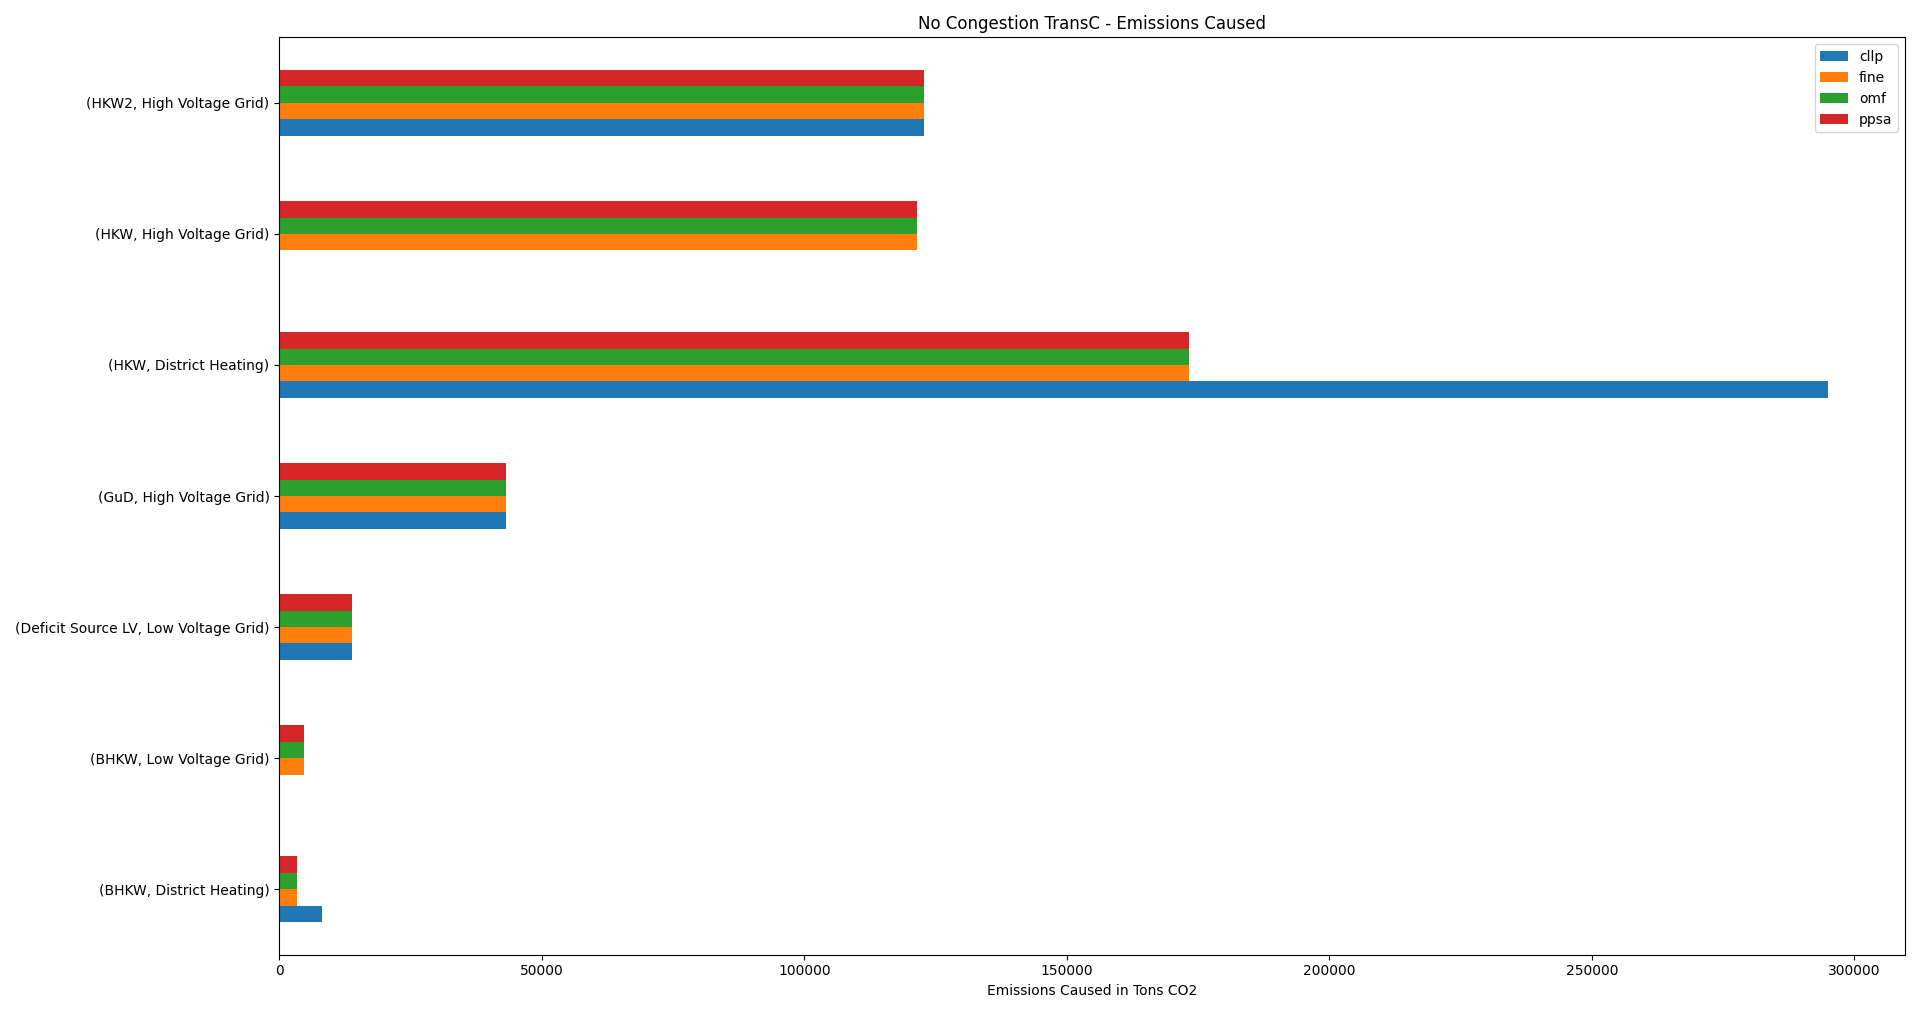
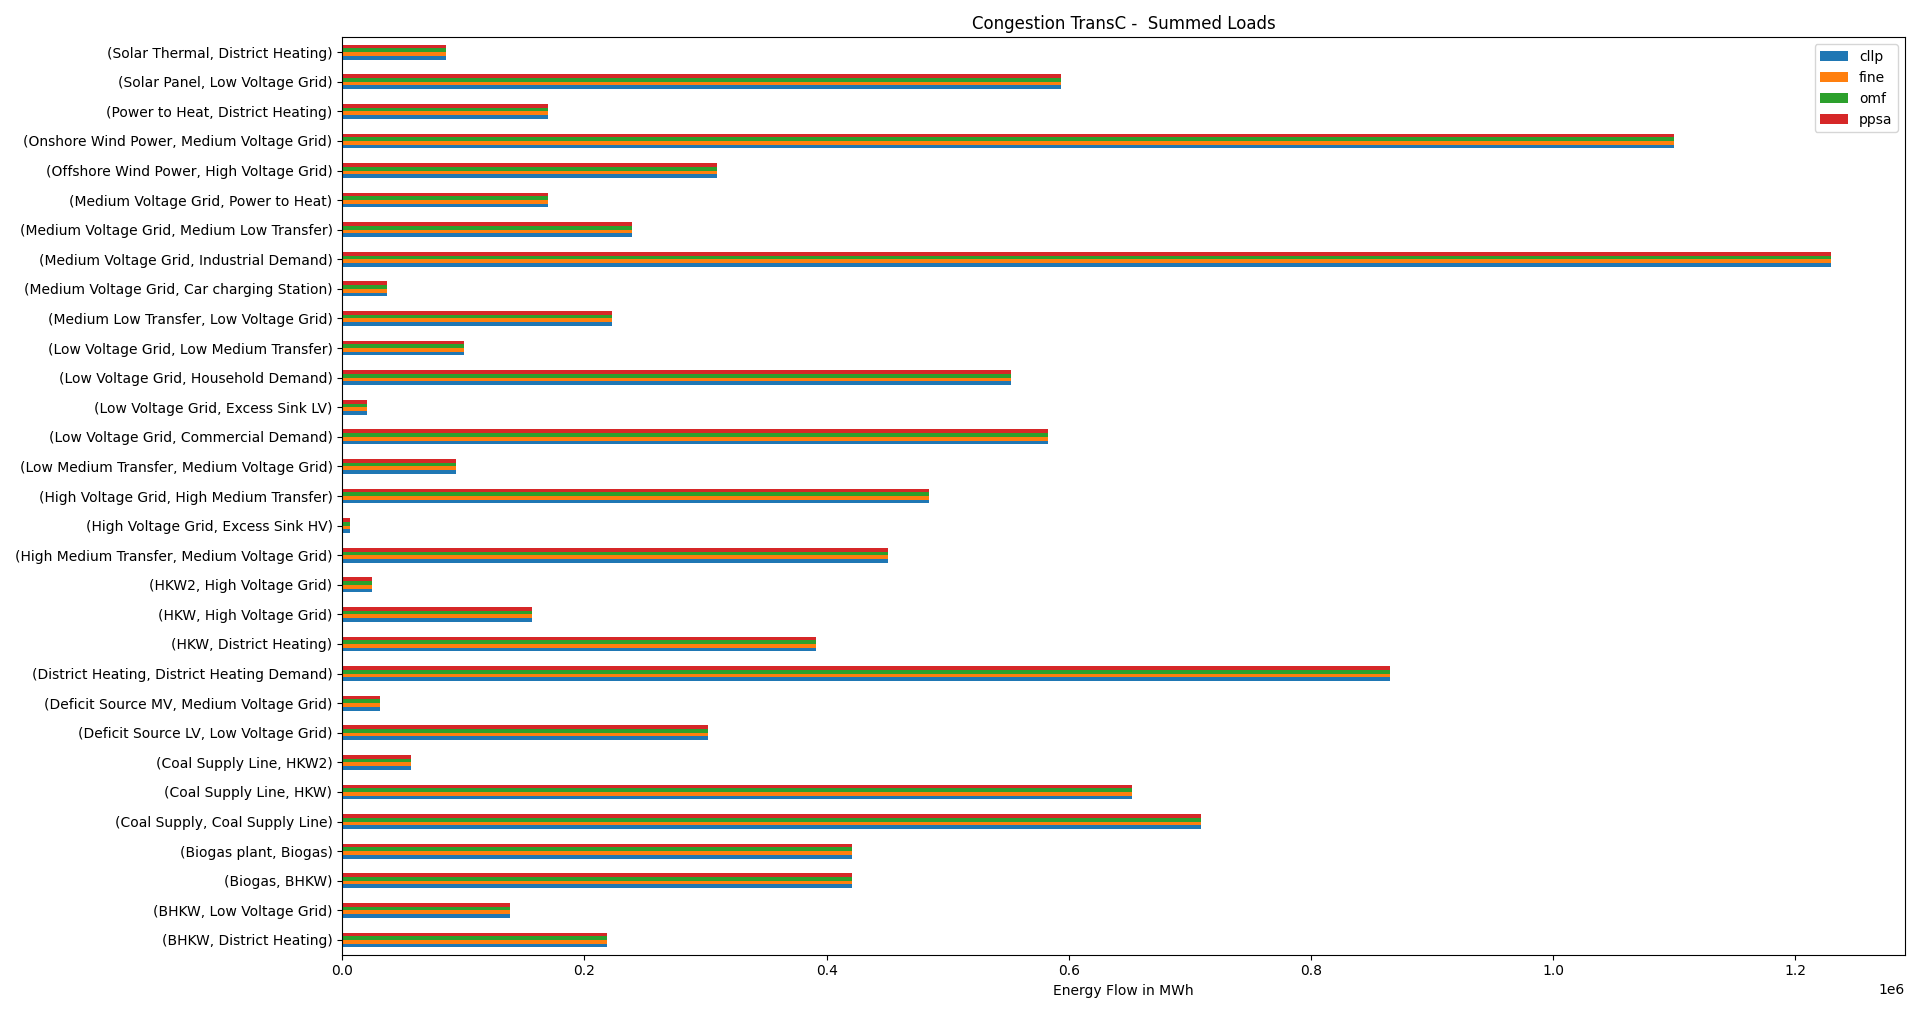
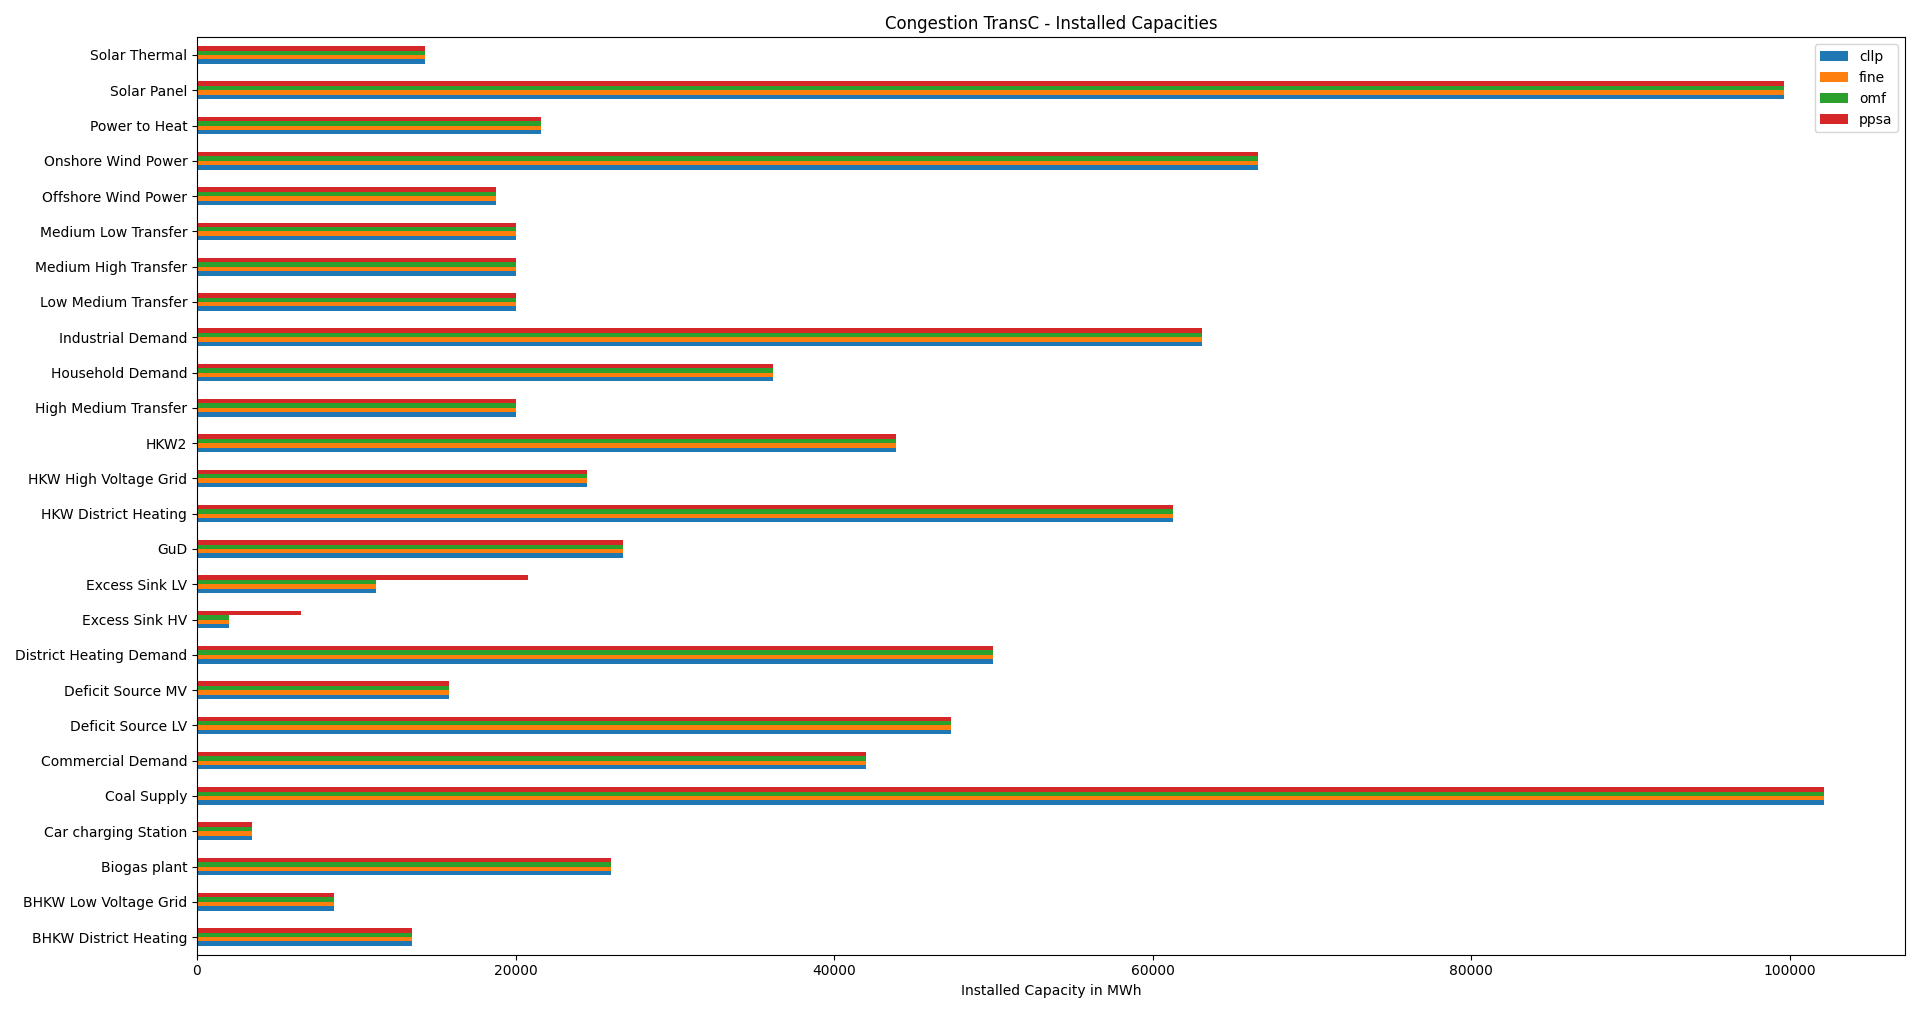
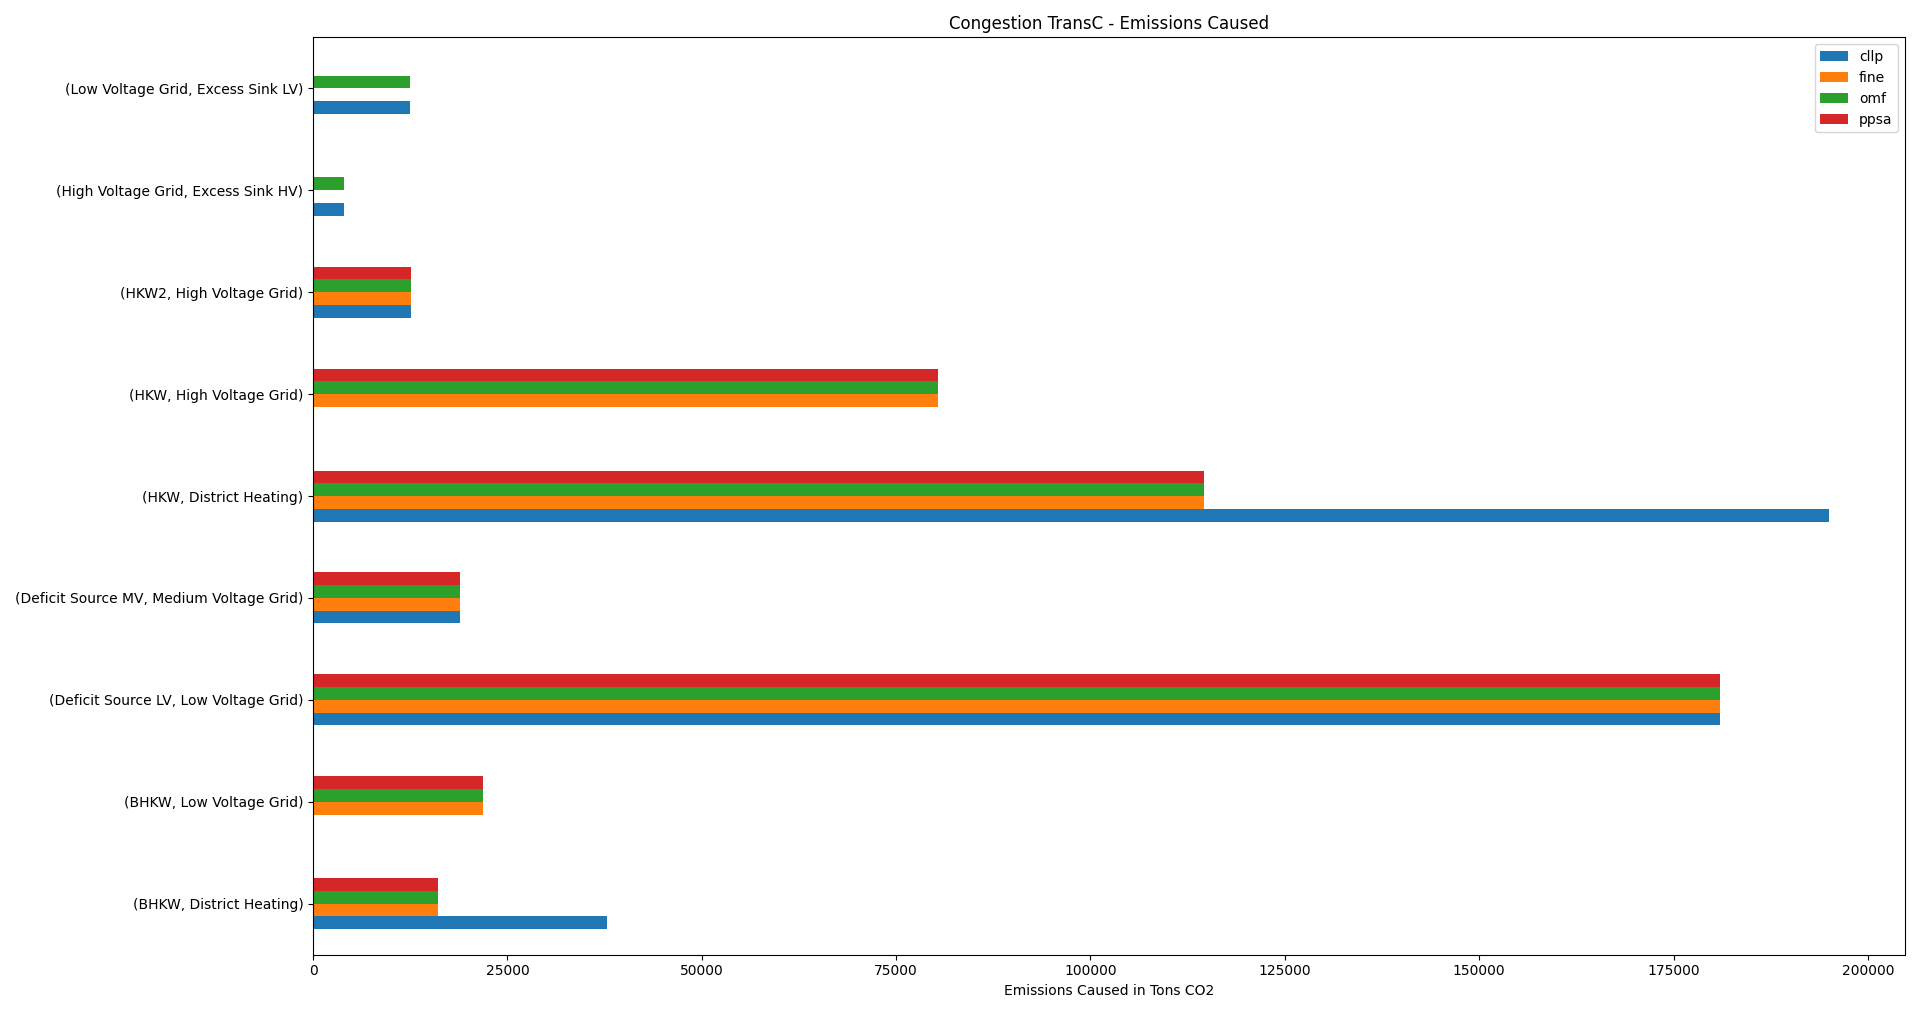
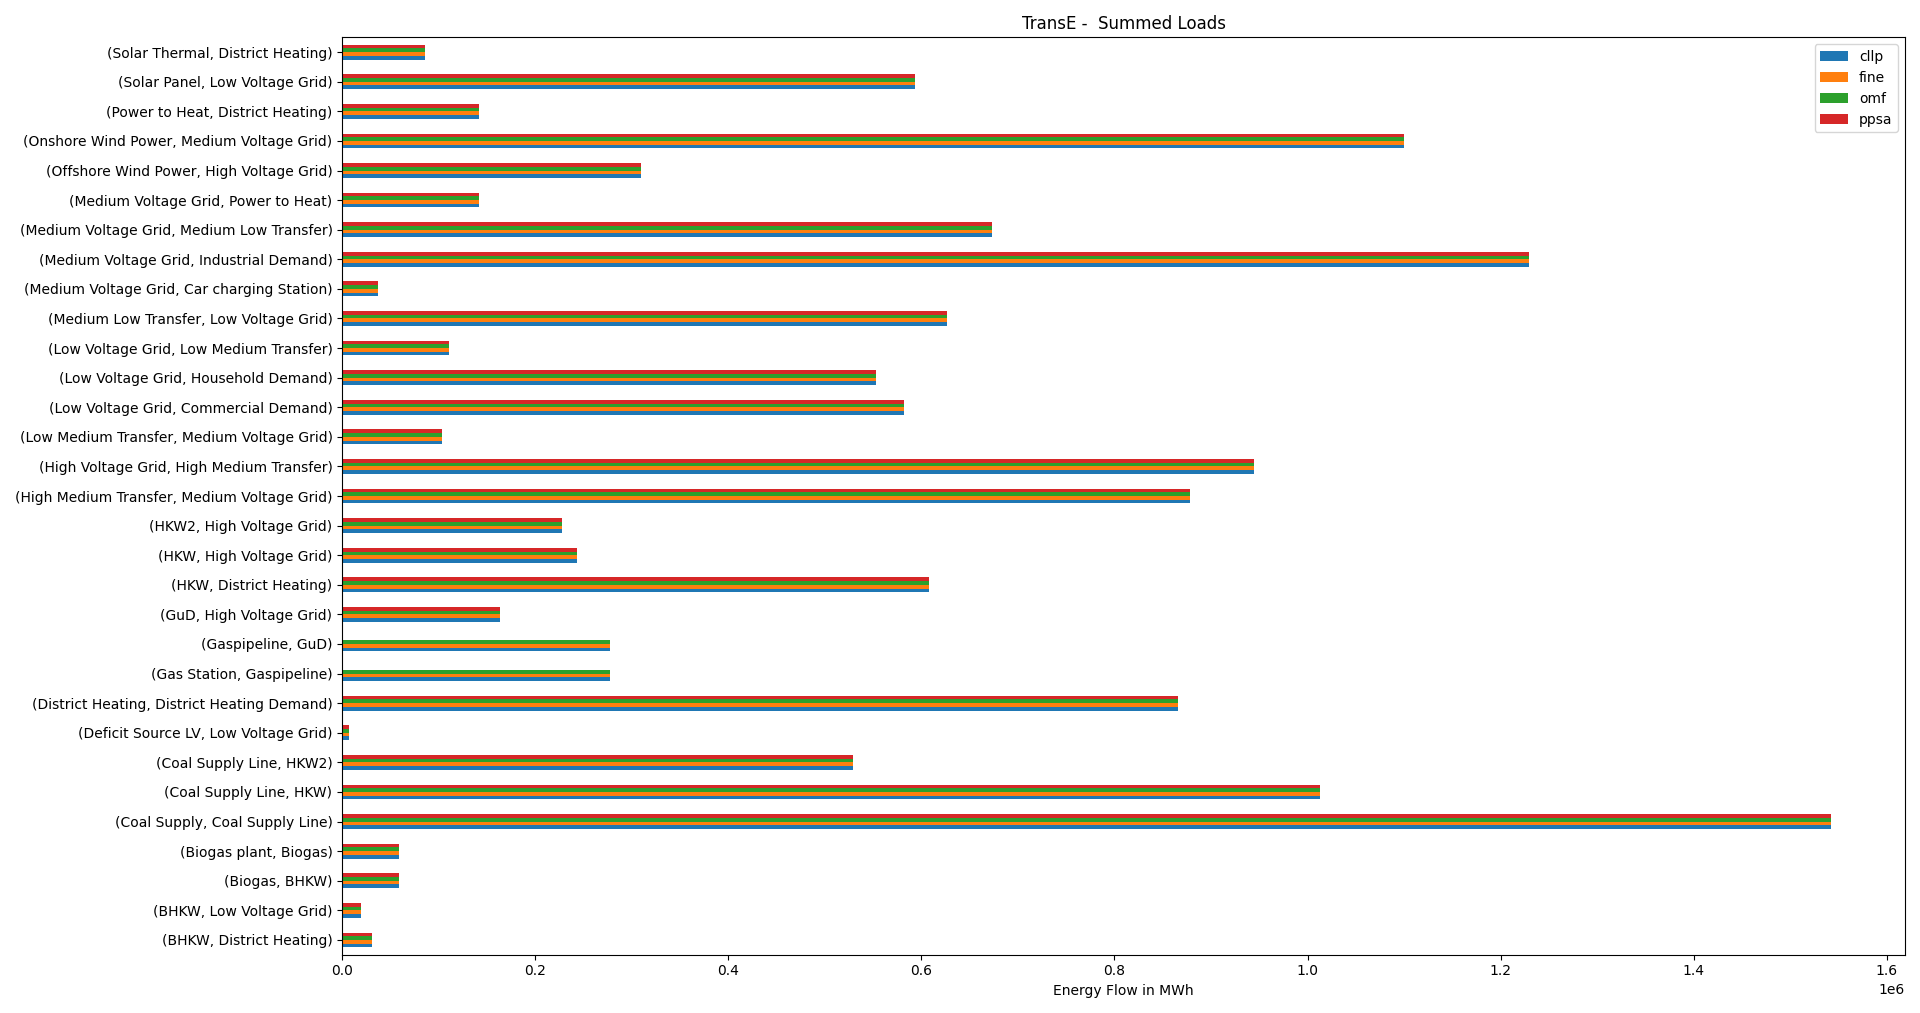
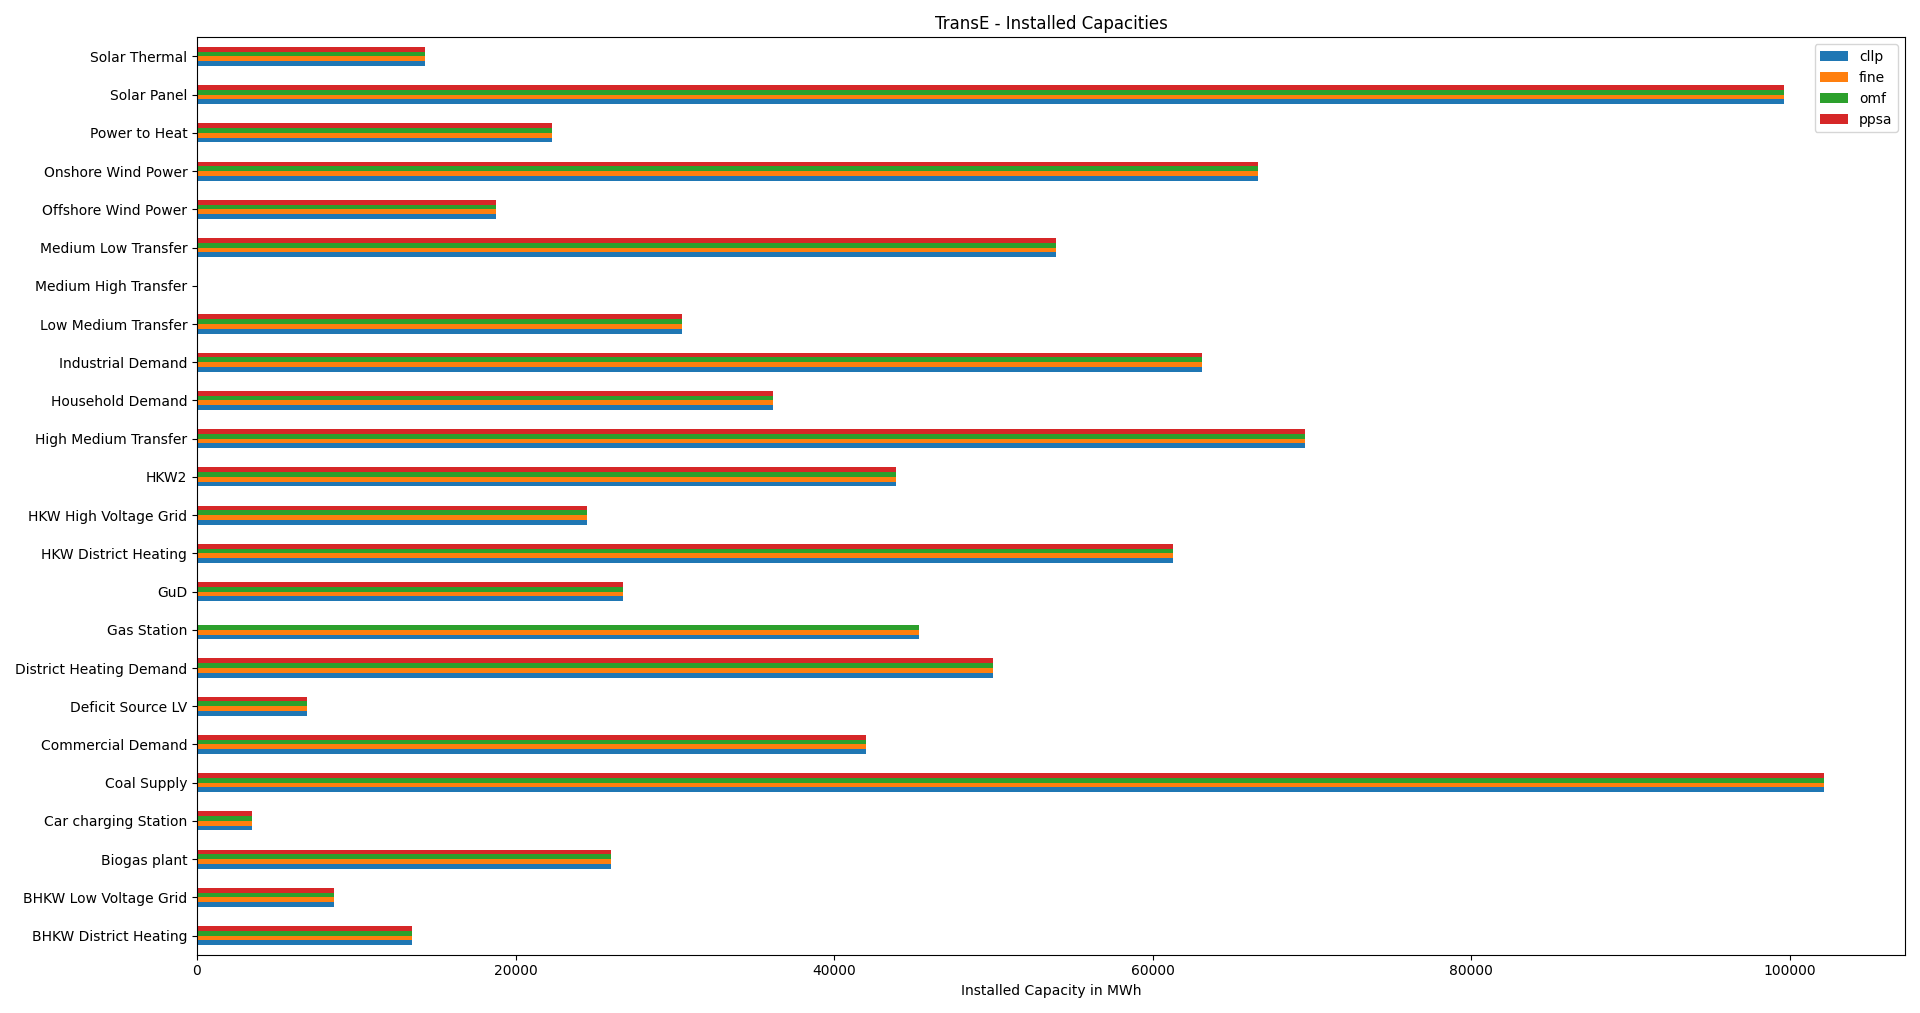
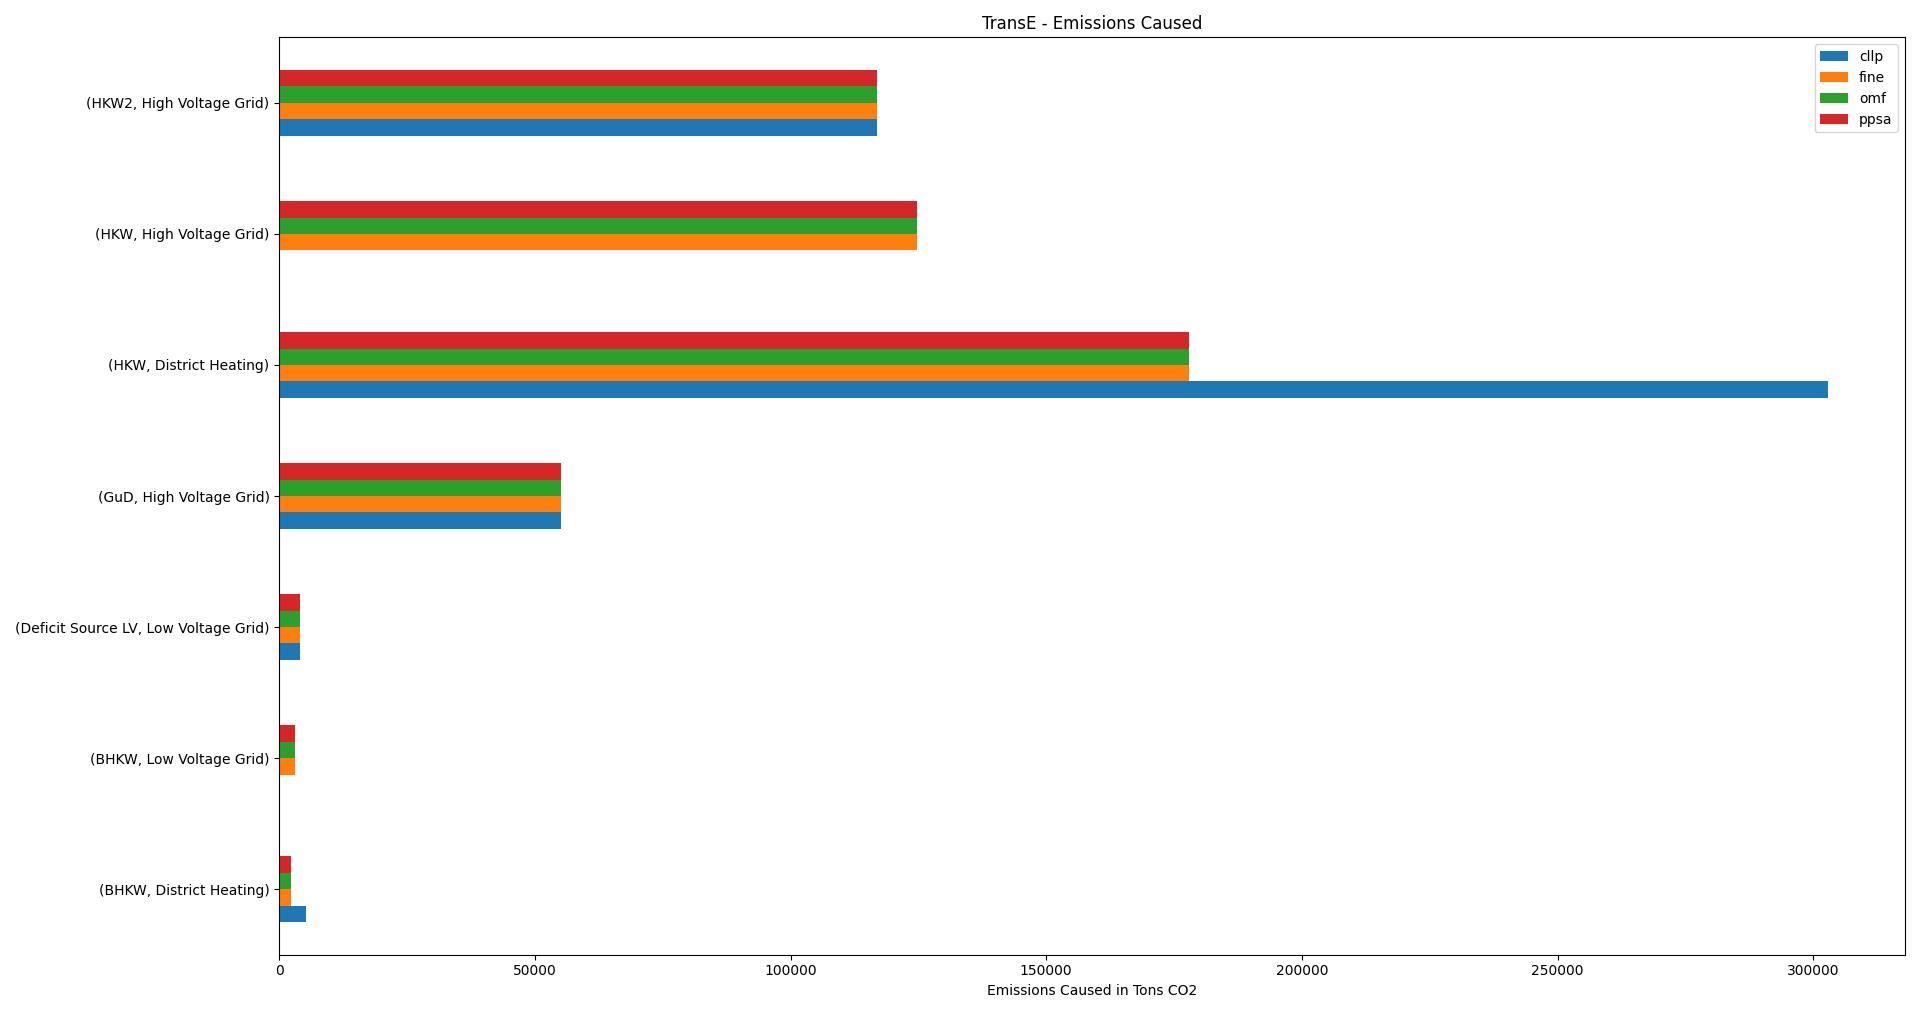
The horizontal bar charts shown below, plot the installed capacities, summed loads and total emissions caused clustered by component for each of the softwares used. Components are not shown where the respective result is zero among the results for all of the investigated softwares.
CompC
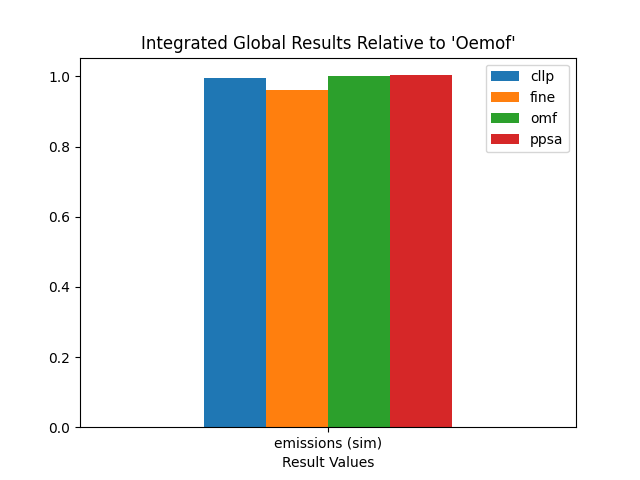
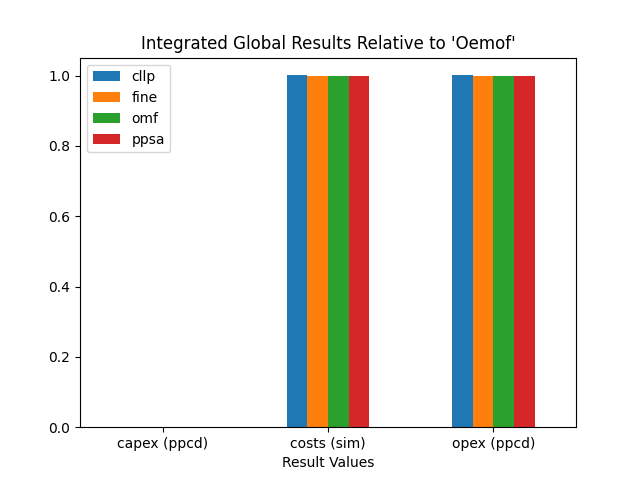
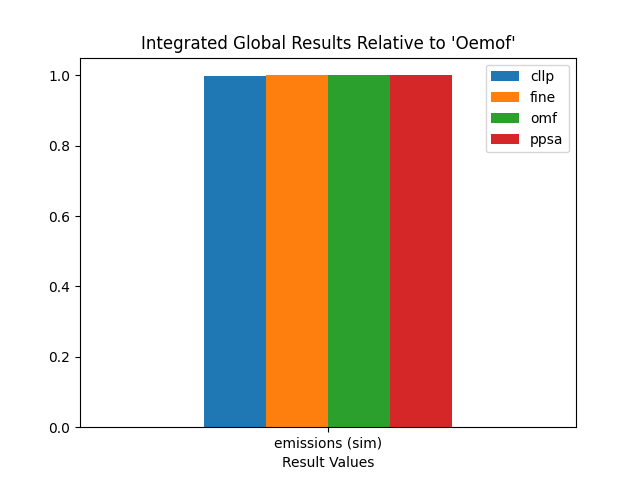
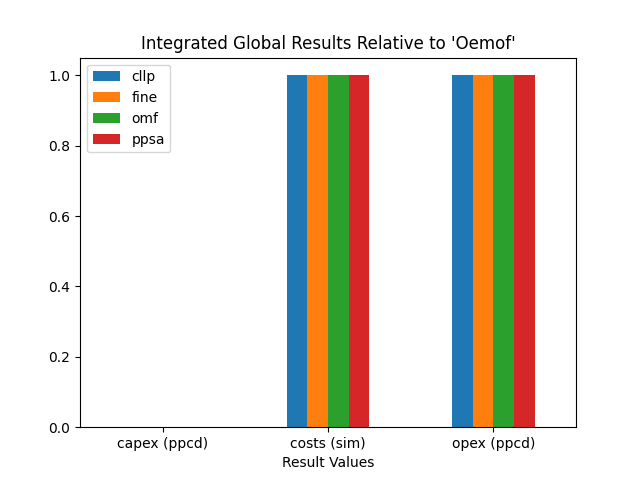
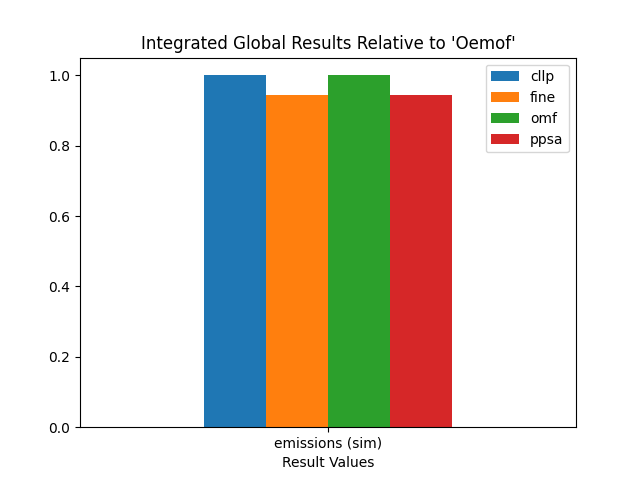
Integrated Global Results
IGR [€ or t_CO2] |
cllp |
fine |
omf |
ppsa |
capex (ppcd) |
0 |
0 |
0 |
0 |
costs (sim) |
688509346 |
688283345 |
688509325 |
688509325 |
emissions (sim) |
6778376 |
6542108 |
6815007 |
6838219 |
opex (ppcd) |
688509352 |
688283344 |
688509325 |
688509325 |

Summed Loads
cllp |
fine |
omf |
ppsa |
||
Combined Cycle PP |
Powerline |
31949 |
31949 |
31949 |
31949 |
Gas Line |
Combined Cycle PP |
53248 |
53248 |
53248 |
0 |
Gas Line |
Heat Plant |
11222 |
11221 |
11221 |
0 |
Gas Station |
Gas Line |
64470 |
64470 |
64470 |
0 |
Hard Coal CHP |
Heatline |
1107098 |
1107115 |
1107094 |
1107094 |
Hard Coal CHP |
Powerline |
1107098 |
1107115 |
1107094 |
1107094 |
Hard Coal PP |
Powerline |
2020953 |
2070182 |
2069797 |
2100746 |
Hard Coal Supply |
Hard Coal Supply Line |
7467634 |
7582164 |
7581216 |
2767736 |
Hard Coal Supply Line |
Hard Coal CHP |
2767744 |
2767787 |
2767736 |
2767736 |
Hard Coal Supply Line |
Hard Coal PP |
4699890 |
4814377 |
4813481 |
0 |
Heat Plant |
Heatline |
10099 |
10099 |
10099 |
10099 |
Heat Storage |
Heatline |
2448 |
2428 |
2448 |
2448 |
Heatline |
Heat Demand |
1116163 |
1116163 |
1116163 |
1116163 |
Heatline |
Heat Storage |
3482 |
3479 |
3479 |
3479 |
Lignite Power Plant |
Powerline |
4132600 |
4132574 |
4132600 |
4132600 |
Lignite Supply |
Lignite Supply Line |
10331500 |
10331435 |
10331500 |
0 |
Lignite Supply Line |
Lignite Power Plant |
10331500 |
10331435 |
10331500 |
0 |
Onshore Wind Turbine |
Powerline |
2081333 |
2081338 |
2081333 |
2081333 |
Powerline |
El Demand |
9809506 |
9809506 |
9809506 |
9809506 |
Solar Panel |
Powerline |
435574 |
386348 |
386734 |
355784 |
Installed Capacities
cllp |
fine |
omf |
ppsa |
|
Battery |
100 |
100 |
100 |
100 |
Biogas CHP Heatline |
250 |
250 |
250 |
250 |
Biogas CHP Powerline |
200 |
200 |
200 |
200 |
Combined Cycle PP |
600 |
600 |
600 |
600 |
El Demand |
1526 |
1526 |
1526 |
1526 |
Gas Station |
357 |
357 |
357 |
0 |
Hard Coal CHP Heatline |
300 |
300 |
300 |
300 |
Hard Coal CHP Powerline |
300 |
300 |
300 |
300 |
Hard Coal PP |
500 |
500 |
500 |
500 |
Hard Coal Supply |
1913 |
1913 |
1913 |
750 |
Heat Demand |
400 |
400 |
400 |
400 |
Heat Plant |
450 |
450 |
450 |
450 |
Heat Storage |
50 |
50 |
50 |
50 |
Lignite Power Plant |
500 |
500 |
500 |
500 |
Lignite Supply |
1250 |
1250 |
1250 |
0 |
Offshore Wind Turbine |
150 |
150 |
150 |
150 |
Onshore Wind Turbine |
1100 |
1100 |
1100 |
1100 |
Power To Heat |
100 |
100 |
100 |
100 |
Solar Panel |
1100 |
1100 |
1100 |
1100 |
Emissions Caused
cllp |
fine |
omf |
ppsa |
||
Combined Cycle PP |
Powerline |
11182 |
11182 |
11182 |
11182 |
Hard Coal CHP |
Heatline |
0 |
66427 |
66426 |
66426 |
Hard Coal CHP |
Powerline |
952104 |
885692 |
885676 |
885676 |
Hard Coal PP |
Powerline |
1616762 |
1656146 |
1655837 |
1680597 |
Heat Plant |
Heatline |
2323 |
2323 |
2323 |
2323 |
Lignite Power Plant |
Powerline |
4132600 |
4132574 |
4132600 |
4132600 |
Onshore Wind Turbine |
Powerline |
41627 |
41627 |
41627 |
41627 |
Solar Panel |
Powerline |
21779 |
19317 |
19337 |
17789 |
CompE
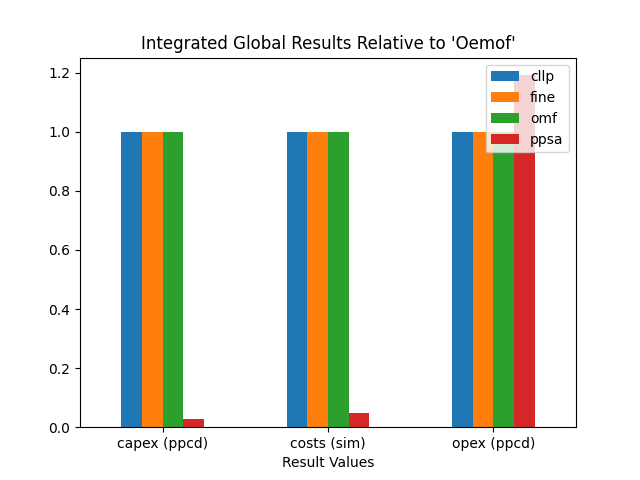
Integrated Global Results
IGR [€ or t_CO2] |
cllp |
fine |
omf |
ppsa |
capex (ppcd) |
41554917514 |
41554976118 |
41554977878 |
1132235997 |
costs (sim) |
42289121225 |
42289118279 |
42289118239 |
2062636560 |
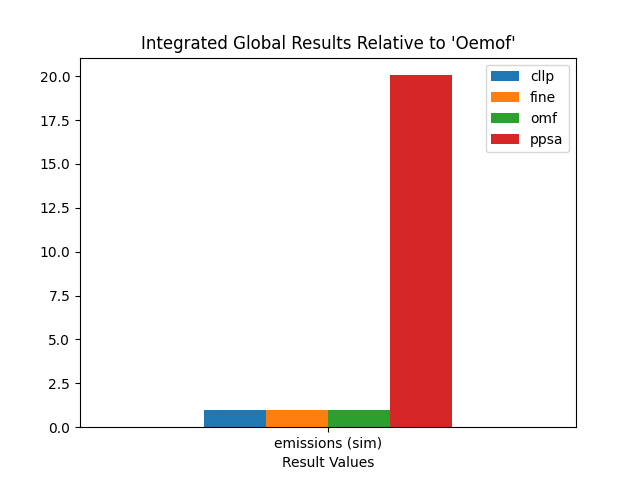
emissions (sim) |
250000 |
250000 |
250000 |
5014819 |
opex (ppcd) |
734204228 |
734140364 |
734140364 |
874603138 |
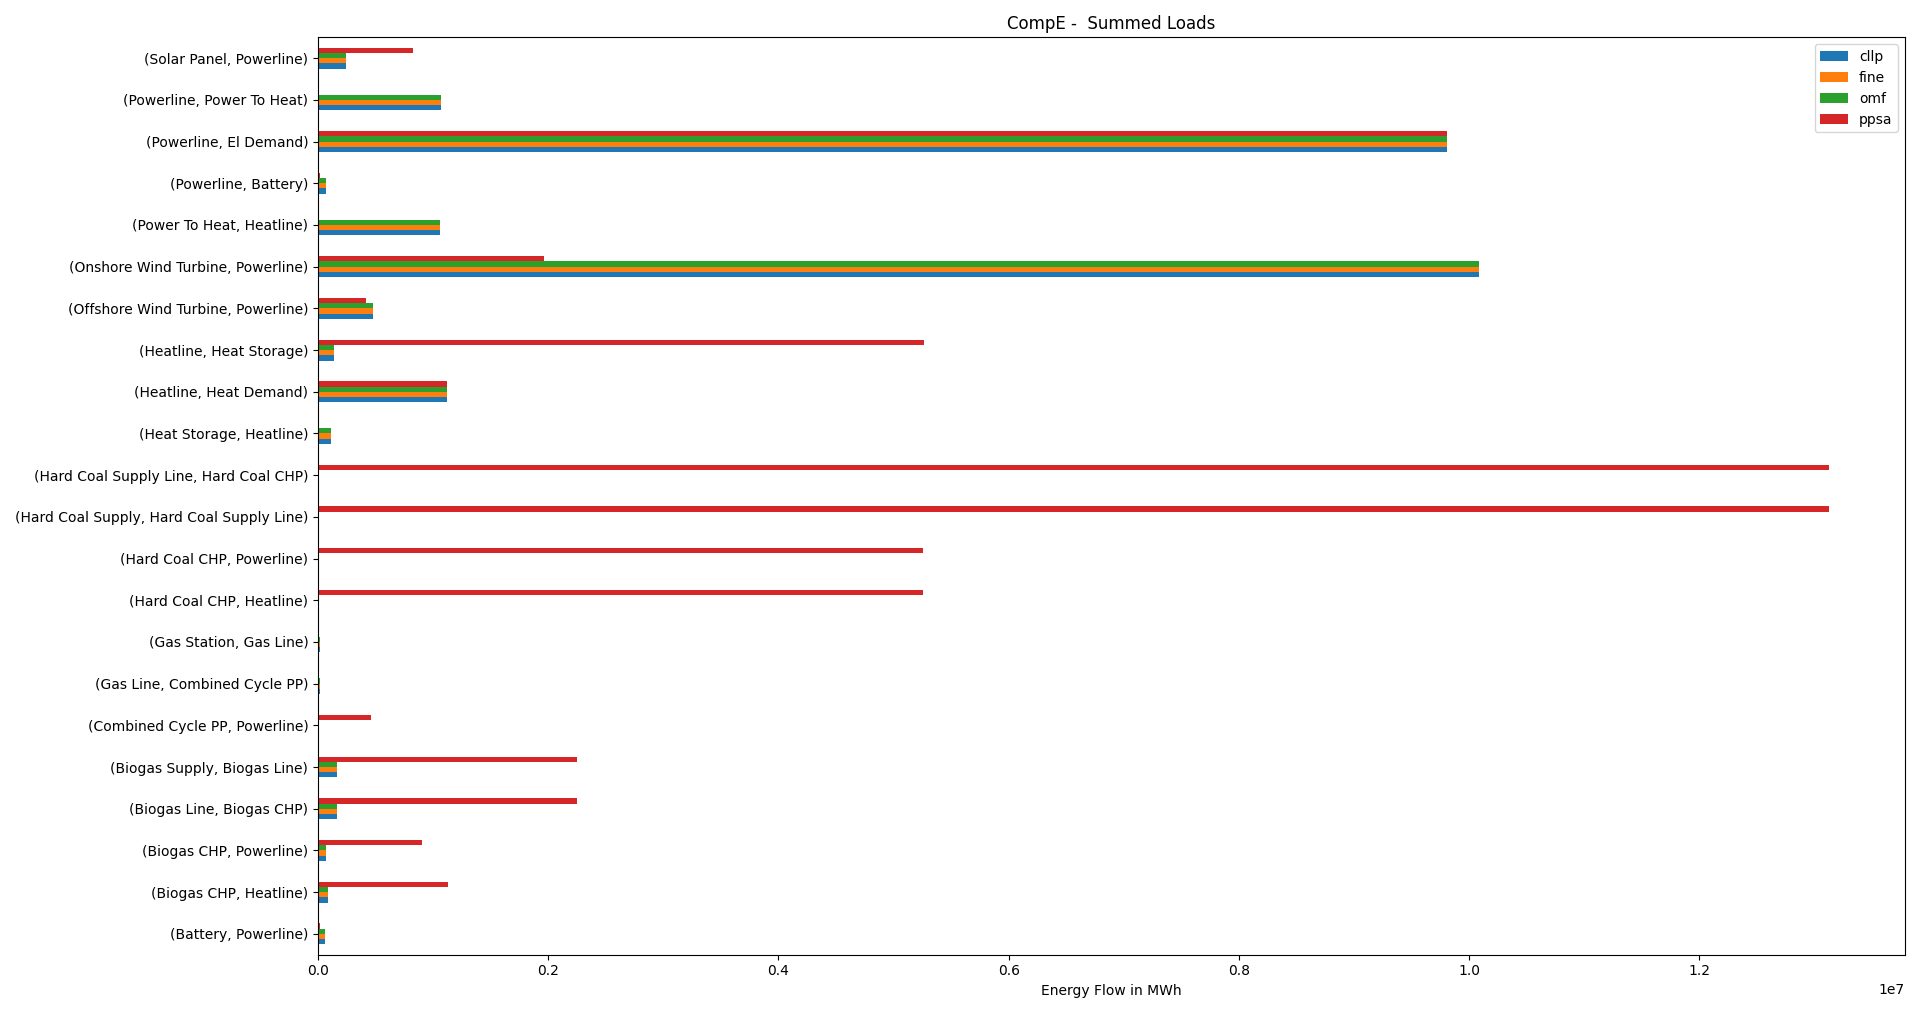
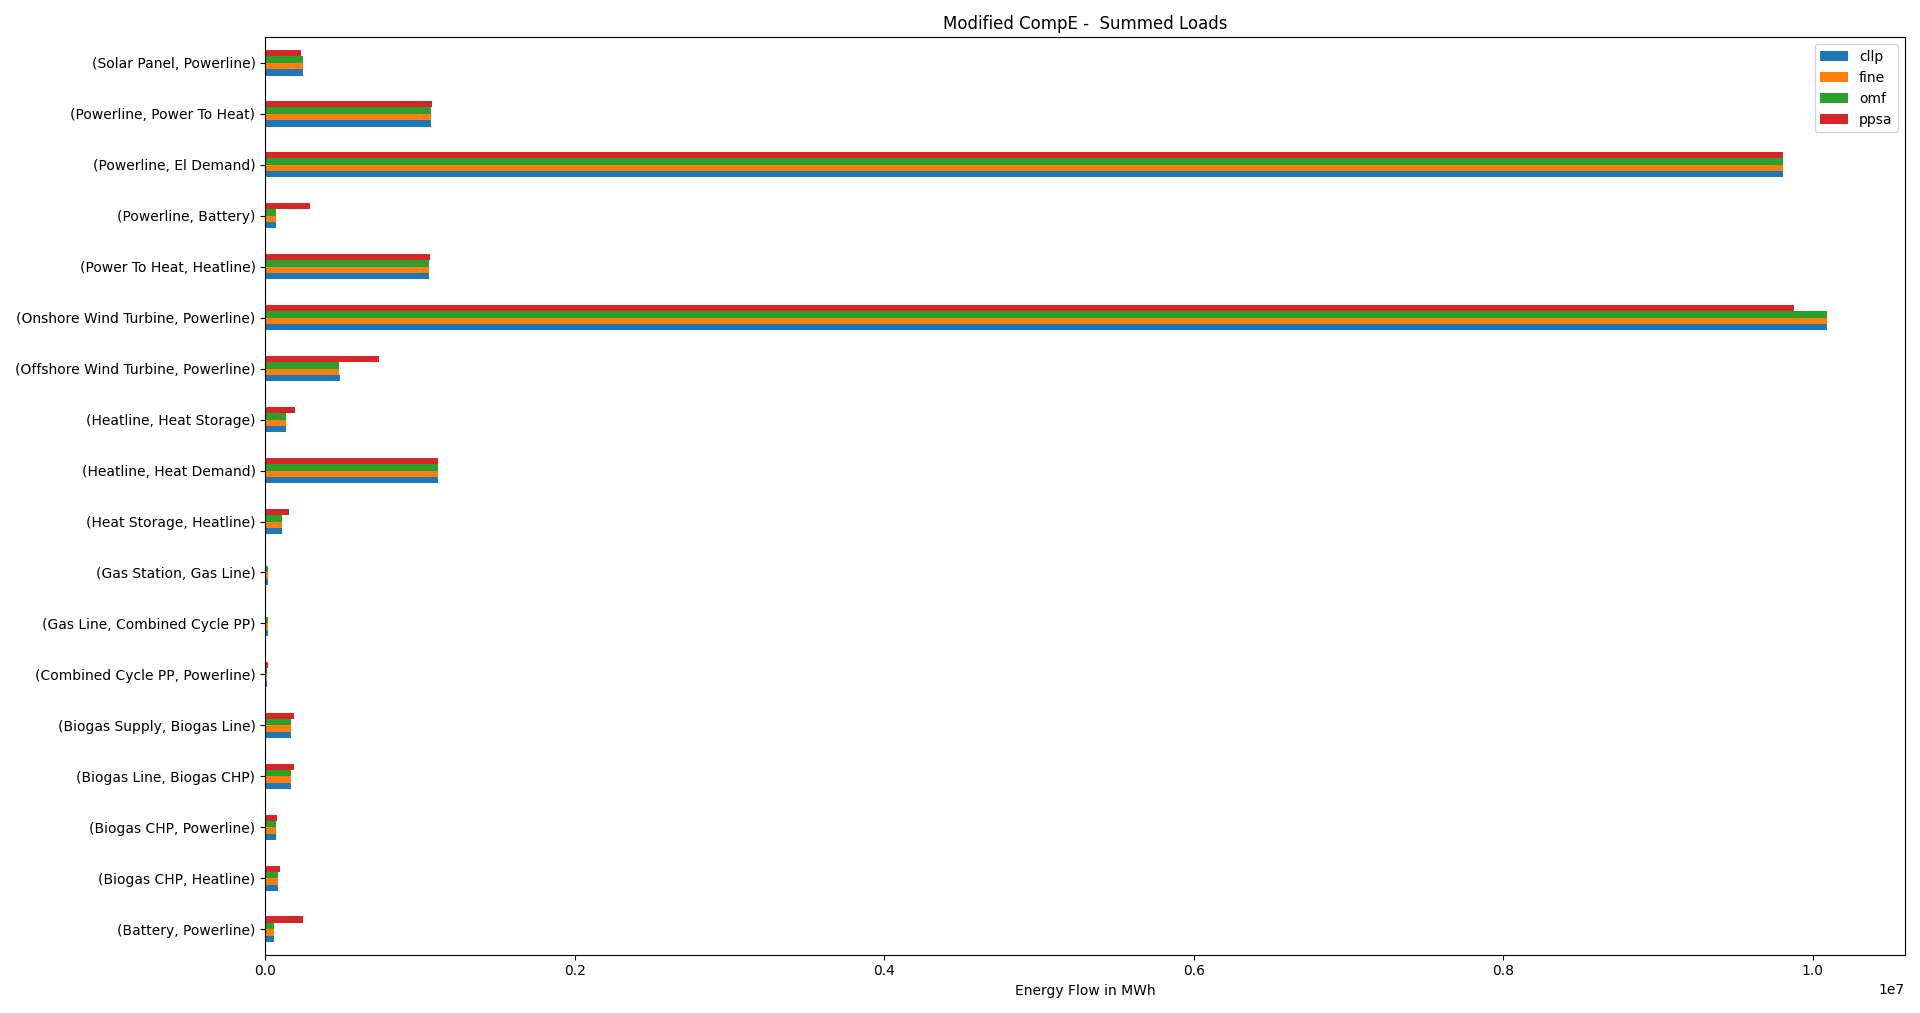
Summed Loads
Following bar charts show the net energy flow results of all softwares grouped by component. Components are not shown, where summed loads are zero among the results of all of the investigated softwares.
cllp |
fine |
omf |
ppsa |
||
Battery |
Powerline |
59185 |
59143 |
59143 |
16594 |
Biogas CHP |
Heatline |
83466 |
83088 |
83088 |
1126470 |
Biogas CHP |
Powerline |
66772 |
66471 |
66471 |
901176 |
Biogas Line |
Biogas CHP |
166931 |
166177 |
166177 |
2252941 |
Biogas Supply |
Biogas Line |
166931 |
166177 |
166177 |
2252941 |
Combined Cycle PP |
Powerline |
11270 |
11513 |
11513 |
460929 |
Gas Line |
Combined Cycle PP |
18783 |
19188 |
19188 |
0 |
Gas Station |
Gas Line |
18783 |
19188 |
19188 |
0 |
Hard Coal CHP |
Heatline |
0 |
0 |
0 |
5252800 |
Hard Coal CHP |
Powerline |
0 |
0 |
0 |
5252800 |
Hard Coal Supply |
Hard Coal Supply Line |
0 |
0 |
0 |
13132000 |
Hard Coal Supply Line |
Hard Coal CHP |
0 |
0 |
0 |
13132000 |
Heat Storage |
Heatline |
110220 |
109928 |
109928 |
1 |
Heatline |
Heat Demand |
1116163 |
1116163 |
1116163 |
1116163 |
Heatline |
Heat Storage |
136673 |
136245 |
136245 |
5263109 |
Offshore Wind Turbine |
Powerline |
480373 |
479668 |
479668 |
412889 |
Onshore Wind Turbine |
Powerline |
10089237 |
10090425 |
10090425 |
1959678 |
Power To Heat |
Heatline |
1059151 |
1059391 |
1059391 |
0 |
Powerline |
Battery |
69736 |
69681 |
69681 |
19032 |
Powerline |
El Demand |
9809506 |
9809506 |
9809506 |
9809506 |
Powerline |
Power To Heat |
1069849 |
1070092 |
1070092 |
0 |
Solar Panel |
Powerline |
242254 |
242061 |
242061 |
824472 |
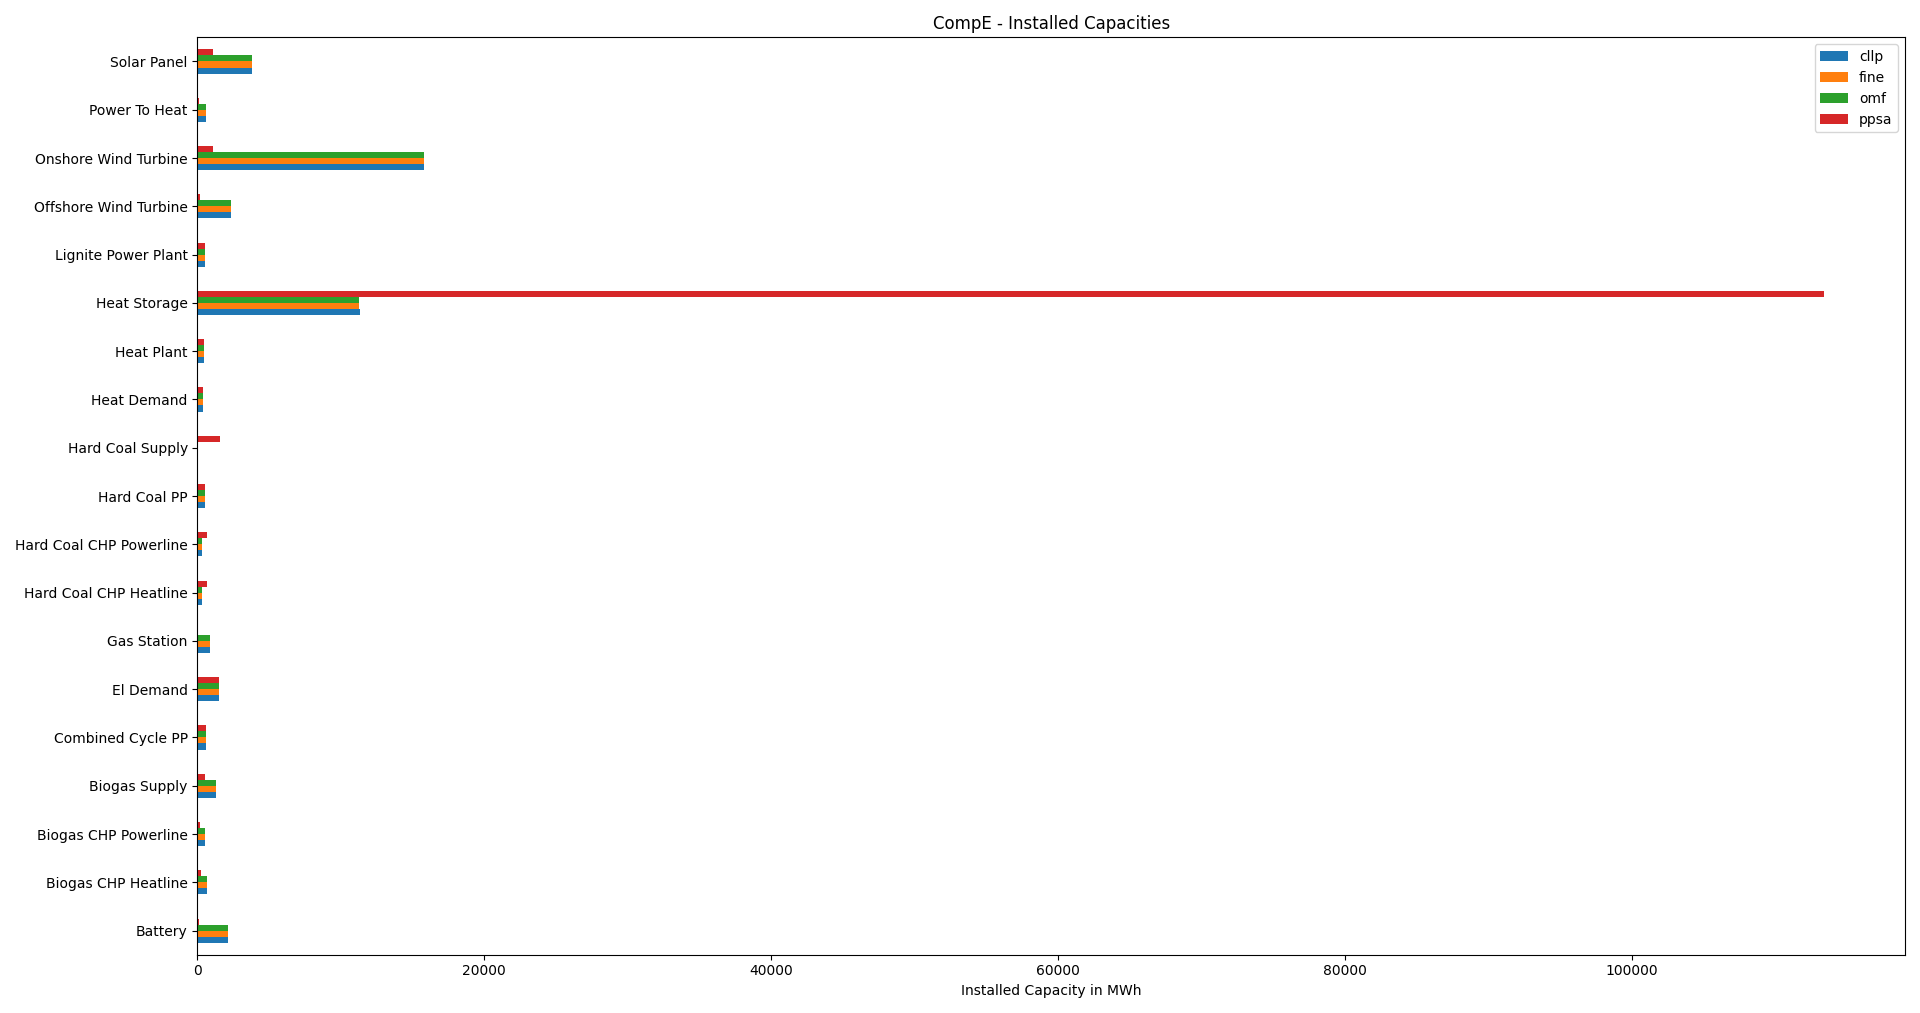
Installed Capacities
cllp |
fine |
omf |
ppsa |
|
Battery |
2105 |
2105 |
2105 |
100 |
Biogas CHP Heatline |
650 |
645 |
645 |
250 |
Biogas CHP Powerline |
520 |
516 |
516 |
200 |
Biogas Supply |
1299 |
1291 |
1291 |
500 |
Combined Cycle PP |
600 |
600 |
600 |
600 |
El Demand |
1526 |
1526 |
1526 |
1526 |
Gas Station |
847 |
853 |
853 |
0 |
Hard Coal CHP Heatline |
300 |
300 |
300 |
631 |
Hard Coal CHP Powerline |
300 |
300 |
300 |
631 |
Hard Coal PP |
500 |
500 |
500 |
500 |
Hard Coal Supply |
0 |
0 |
0 |
1577 |
Heat Demand |
400 |
400 |
400 |
400 |
Heat Plant |
450 |
450 |
450 |
450 |
Heat Storage |
11358 |
11273 |
11273 |
113392 |
Lignite Power Plant |
500 |
500 |
500 |
500 |
Offshore Wind Turbine |
2347 |
2346 |
2346 |
150 |
Onshore Wind Turbine |
15776 |
15788 |
15788 |
1100 |
Power To Heat |
576 |
576 |
576 |
100 |
Solar Panel |
3812 |
3810 |
3810 |
1100 |
Emissions Caused
cllp |
fine |
omf |
ppsa |
||
Battery |
Powerline |
3551 |
3549 |
3549 |
996 |
Biogas CHP |
Heatline |
0 |
1558 |
1558 |
21121 |
Biogas CHP |
Powerline |
18258 |
16618 |
16618 |
225294 |
Combined Cycle PP |
Powerline |
3945 |
4029 |
4029 |
161325 |
Hard Coal CHP |
Heatline |
0 |
0 |
0 |
315168 |
Hard Coal CHP |
Powerline |
0 |
0 |
0 |
4202240 |
Offshore Wind Turbine |
Powerline |
9607 |
9593 |
9593 |
8258 |
Onshore Wind Turbine |
Powerline |
201785 |
201808 |
201808 |
39194 |
Power To Heat |
Heatline |
741 |
742 |
742 |
0 |
Solar Panel |
Powerline |
12113 |
12103 |
12103 |
41224 |
Modified CompE
Integrated Global Results
IGR [€ or t_CO2] |
cllp |
fine |
omf |
ppsa |
capex (ppcd) |
41554917514 |
41554976118 |
41554977878 |
36904768288 |
costs (sim) |
42289121225 |
42289118279 |
42289118239 |
37727776780 |
emissions (sim) |
250000 |
250000 |
250000 |
265508 |
opex (ppcd) |
734204228 |
734140364 |
734140364 |
823007841 |
Summed Loads
cllp |
fine |
omf |
ppsa |
||
Battery |
Powerline |
59185 |
59143 |
59143 |
242275 |
Biogas CHP |
Heatline |
83466 |
83088 |
83088 |
92271 |
Biogas CHP |
Powerline |
66772 |
66471 |
66471 |
73817 |
Biogas Line |
Biogas CHP |
166931 |
166177 |
166177 |
184542 |
Biogas Supply |
Biogas Line |
166931 |
166177 |
166177 |
184542 |
Combined Cycle PP |
Powerline |
11270 |
11513 |
11513 |
18191 |
Gas Line |
Combined Cycle PP |
18783 |
19188 |
19188 |
0 |
Gas Station |
Gas Line |
18783 |
19188 |
19188 |
0 |
Heat Storage |
Heatline |
110220 |
109928 |
109928 |
150745 |
Heatline |
Heat Demand |
1116163 |
1116163 |
1116163 |
1116163 |
Heatline |
Heat Storage |
136673 |
136245 |
136245 |
191931 |
Offshore Wind Turbine |
Powerline |
480373 |
479668 |
479668 |
733059 |
Onshore Wind Turbine |
Powerline |
10089237 |
10090425 |
10090425 |
9880008 |
Power To Heat |
Heatline |
1059151 |
1059391 |
1059391 |
1065078 |
Powerline |
Battery |
69736 |
69681 |
69681 |
290282 |
Powerline |
El Demand |
9809506 |
9809506 |
9809506 |
9809506 |
Powerline |
Power To Heat |
1069849 |
1070092 |
1070092 |
1075836 |
Solar Panel |
Powerline |
242254 |
242061 |
242061 |
228273 |
Installed Capacities
cllp |
fine |
omf |
ppsa |
|
Battery |
2105 |
2105 |
2105 |
3770 |
Biogas CHP Heatline |
650 |
645 |
645 |
550 |
Biogas CHP Powerline |
520 |
516 |
516 |
440 |
Biogas Supply |
1299 |
1291 |
1291 |
1101 |
Combined Cycle PP |
600 |
600 |
600 |
600 |
El Demand |
1526 |
1526 |
1526 |
1526 |
Gas Station |
847 |
853 |
853 |
0 |
Hard Coal CHP Heatline |
300 |
300 |
300 |
300 |
Hard Coal CHP Powerline |
300 |
300 |
300 |
300 |
Hard Coal PP |
500 |
500 |
500 |
500 |
Heat Demand |
400 |
400 |
400 |
400 |
Heat Plant |
450 |
450 |
450 |
450 |
Heat Storage |
11358 |
11273 |
11273 |
11082 |
Lignite Power Plant |
500 |
500 |
500 |
500 |
Offshore Wind Turbine |
2347 |
2346 |
2346 |
1947 |
Onshore Wind Turbine |
15776 |
15788 |
15788 |
12703 |
Power To Heat |
576 |
576 |
576 |
634 |
Solar Panel |
3812 |
3810 |
3810 |
3685 |
Emissions Caused
cllp |
fine |
omf |
ppsa |
||
Battery |
Powerline |
3551 |
3549 |
3549 |
14537 |
Biogas CHP |
Heatline |
0 |
1558 |
1558 |
0 |
Biogas CHP |
Powerline |
18258 |
16618 |
16618 |
0 |
Biogas Supply |
Biogas Line |
0 |
0 |
0 |
20184 |
Combined Cycle PP |
Powerline |
3945 |
4029 |
4029 |
6367 |
Offshore Wind Turbine |
Powerline |
9607 |
9593 |
9593 |
14661 |
Onshore Wind Turbine |
Powerline |
201785 |
201808 |
201808 |
197600 |
Power To Heat |
Heatline |
741 |
742 |
742 |
746 |
Solar Panel |
Powerline |
12113 |
12103 |
12103 |
11414 |
LossLC
Integrated Global Results
IGR [€ or t_CO2] |
cllp |
fine |
omf |
ppsa |
capex (ppcd) |
0 |
0 |
0 |
0 |
costs (sim) |
202437193 |
202259102 |
202259102 |
202259102 |
emissions (sim) |
441567 |
443159 |
443159 |
443159 |
opex (ppcd) |
202437194 |
202259103 |
202259103 |
202259103 |
Summed Loads
cllp |
fine |
omf |
ppsa |
||
BHKW |
District Heating |
19563 |
13826 |
13826 |
13826 |
BHKW |
Low Voltage Grid |
12415 |
8774 |
8774 |
8774 |
Biogas |
BHKW |
37620 |
26588 |
26588 |
26588 |
Biogas plant |
Biogas |
37620 |
26588 |
26588 |
26588 |
Coal Supply |
Coal Supply Line |
1459132 |
1459132 |
1459132 |
1459132 |
Coal Supply Line |
HKW |
980730 |
990291 |
990291 |
990291 |
Coal Supply Line |
HKW2 |
478403 |
468841 |
468841 |
468841 |
District Heating |
District Heating Demand |
865460 |
865460 |
865460 |
865460 |
Gas Station |
Gaspipeline |
197524 |
206773 |
206773 |
0 |
Gaspipeline |
GuD |
197524 |
206773 |
206773 |
0 |
GuD |
High Voltage Grid |
116539 |
121996 |
121996 |
121996 |
HKW |
District Heating |
588438 |
594175 |
594175 |
594175 |
HKW |
High Voltage Grid |
235375 |
237670 |
237670 |
237670 |
HKW2 |
High Voltage Grid |
205713 |
201602 |
201602 |
201602 |
High Voltage Grid |
High Voltage Transfer Grid |
867449 |
871089 |
871089 |
871089 |
High Voltage Transfer Grid |
Medium Voltage Grid |
867449 |
871089 |
871089 |
871089 |
Low Voltage Grid |
Commercial Demand |
582460 |
582460 |
582460 |
582460 |
Low Voltage Grid |
Household Demand |
552565 |
552565 |
552565 |
552565 |
Low Voltage Grid |
Low Voltage Transfer Grid |
111125 |
111125 |
111125 |
111125 |
Low Voltage Transfer Grid |
Low Voltage Grid |
640388 |
644029 |
644029 |
644029 |
Low Voltage Transfer Grid |
Medium Voltage Grid |
111125 |
111125 |
111125 |
111125 |
Medium Voltage Grid |
Car charging Station |
37026 |
37026 |
37026 |
37026 |
Medium Voltage Grid |
Industrial Demand |
1229008 |
1229008 |
1229008 |
1229008 |
Medium Voltage Grid |
Low Voltage Transfer Grid |
640388 |
644029 |
644029 |
644029 |
Medium Voltage Grid |
Power to Heat |
172018 |
172018 |
172018 |
172018 |
Offshore Wind Power |
High Voltage Grid |
309822 |
309822 |
309822 |
309822 |
Onshore Wind Power |
Medium Voltage Grid |
1099866 |
1099866 |
1099866 |
1099866 |
Power to Heat |
District Heating |
172018 |
172018 |
172018 |
172018 |
Solar Panel |
Low Voltage Grid |
593347 |
593347 |
593347 |
593347 |
Solar Thermal |
District Heating |
85442 |
85442 |
85442 |
85442 |
Installed Capacities
cllp |
fine |
omf |
ppsa |
|
BHKW District Heating |
13514 |
13514 |
13514 |
13514 |
BHKW Low Voltage Grid |
8576 |
8576 |
8576 |
8576 |
Biogas plant |
25988 |
25988 |
25988 |
25988 |
Car charging Station |
3473 |
3473 |
3473 |
3473 |
Coal Supply |
102123 |
102123 |
102123 |
102123 |
Commercial Demand |
41970 |
41970 |
41970 |
41970 |
District Heating Demand |
50000 |
50000 |
50000 |
50000 |
Gas Station |
45325 |
45325 |
45325 |
0 |
GuD |
26742 |
26742 |
26742 |
26742 |
HKW District Heating |
61274 |
61274 |
61274 |
61274 |
HKW High Voltage Grid |
24510 |
24510 |
24510 |
24510 |
HKW2 |
43913 |
43913 |
43913 |
43913 |
Household Demand |
36178 |
36178 |
36178 |
36178 |
Industrial Demand |
63094 |
63094 |
63094 |
63094 |
Offshore Wind Power |
18760 |
18760 |
18760 |
18760 |
Onshore Wind Power |
66599 |
66599 |
66599 |
66599 |
Power to Heat |
50000 |
50000 |
50000 |
50000 |
Solar Panel |
99606 |
99606 |
99606 |
99606 |
Solar Thermal |
14343 |
14343 |
14343 |
14343 |
High Voltage Transfer Grid |
0 |
0 |
0 |
72141 |
Low Voltage Transfer Grid |
0 |
54704 |
0 |
54704 |
Emissions Caused
cllp |
fine |
omf |
ppsa |
||
BHKW |
District Heating |
0 |
1012 |
1012 |
1012 |
BHKW |
Low Voltage Grid |
3385 |
1380 |
1380 |
1380 |
GuD |
High Voltage Grid |
39227 |
41064 |
41064 |
41064 |
HKW |
District Heating |
0 |
174093 |
174093 |
174093 |
HKW |
High Voltage Grid |
293301 |
122067 |
122067 |
122067 |
HKW2 |
High Voltage Grid |
105654 |
103543 |
103543 |
103543 |
No Congestion TransC
Integrated Global Results
IGR [€ or t_CO2] |
cllp |
fine |
omf |
ppsa |
capex (ppcd) |
0 |
0 |
0 |
0 |
costs (sim) |
231793808 |
231793807 |
231793807 |
231793807 |
emissions (sim) |
482759 |
482759 |
482759 |
482759 |
opex (ppcd) |
231793807 |
231793807 |
231793806 |
231793807 |

Summed Loads
cllp |
fine |
omf |
ppsa |
||
BHKW |
District Heating |
46711 |
46711 |
46711 |
46711 |
BHKW |
Low Voltage Grid |
29643 |
29643 |
29643 |
29643 |
Biogas |
BHKW |
89828 |
89828 |
89828 |
89828 |
Biogas plant |
Biogas |
89828 |
89828 |
89828 |
89828 |
Coal Supply |
Coal Supply Line |
1541802 |
1541802 |
1541802 |
1541802 |
Coal Supply Line |
HKW |
986044 |
986044 |
986044 |
986044 |
Coal Supply Line |
HKW2 |
555758 |
555758 |
555758 |
555758 |
Deficit Source LV |
Low Voltage Grid |
23215 |
23215 |
23215 |
23215 |
District Heating |
District Heating Demand |
865460 |
865460 |
865460 |
865460 |
Gas Station |
Gaspipeline |
217127 |
217127 |
217127 |
0 |
Gaspipeline |
GuD |
217127 |
217127 |
217127 |
0 |
GuD |
High Voltage Grid |
128105 |
128105 |
128105 |
128105 |
HKW |
District Heating |
591627 |
591627 |
591627 |
591627 |
HKW |
High Voltage Grid |
236651 |
236651 |
236651 |
236651 |
HKW2 |
High Voltage Grid |
238976 |
238976 |
238976 |
238976 |
High Medium Transfer |
Medium Voltage Grid |
849604 |
849604 |
849604 |
849604 |
High Voltage Grid |
High Medium Transfer |
913553 |
913553 |
913553 |
913553 |
Low Medium Transfer |
Medium Voltage Grid |
103346 |
103346 |
103346 |
103346 |
Low Voltage Grid |
Commercial Demand |
582460 |
582460 |
582460 |
582460 |
Low Voltage Grid |
Household Demand |
552565 |
552565 |
552565 |
552565 |
Low Voltage Grid |
Low Medium Transfer |
111125 |
111125 |
111125 |
111125 |
Medium Low Transfer |
Low Voltage Grid |
599945 |
599945 |
599945 |
599945 |
Medium Voltage Grid |
Car charging Station |
37026 |
37026 |
37026 |
37026 |
Medium Voltage Grid |
Industrial Demand |
1229008 |
1229008 |
1229008 |
1229008 |
Medium Voltage Grid |
Medium Low Transfer |
645102 |
645102 |
645102 |
645102 |
Medium Voltage Grid |
Power to Heat |
141681 |
141681 |
141681 |
141681 |
Offshore Wind Power |
High Voltage Grid |
309822 |
309822 |
309822 |
309822 |
Onshore Wind Power |
Medium Voltage Grid |
1099866 |
1099866 |
1099866 |
1099866 |
Power to Heat |
District Heating |
141681 |
141681 |
141681 |
141681 |
Solar Panel |
Low Voltage Grid |
593347 |
593347 |
593347 |
593347 |
Solar Thermal |
District Heating |
85442 |
85442 |
85442 |
85442 |
Installed Capacities
cllp |
fine |
omf |
ppsa |
|
BHKW District Heating |
13514 |
13514 |
13514 |
13514 |
BHKW Low Voltage Grid |
8576 |
8576 |
8576 |
8576 |
Biogas plant |
25988 |
25988 |
25988 |
25988 |
Car charging Station |
3473 |
3473 |
3473 |
3473 |
Coal Supply |
102123 |
102123 |
102123 |
102123 |
Commercial Demand |
41970 |
41970 |
41970 |
41970 |
Deficit Source LV |
13854 |
13854 |
13854 |
13854 |
District Heating Demand |
50000 |
50000 |
50000 |
50000 |
Gas Station |
33219 |
33219 |
33219 |
0 |
GuD |
26742 |
26742 |
26742 |
26742 |
HKW District Heating |
61274 |
61274 |
61274 |
61274 |
HKW High Voltage Grid |
24510 |
24510 |
24510 |
24510 |
HKW2 |
43913 |
43913 |
43913 |
43913 |
High Medium Transfer |
60000 |
60000 |
60000 |
60000 |
Household Demand |
36178 |
36178 |
36178 |
36178 |
Industrial Demand |
63094 |
63094 |
63094 |
63094 |
Low Medium Transfer |
60000 |
60000 |
60000 |
60000 |
Medium High Transfer |
60000 |
60000 |
60000 |
60000 |
Medium Low Transfer |
60000 |
60000 |
60000 |
60000 |
Offshore Wind Power |
18760 |
18760 |
18760 |
18760 |
Onshore Wind Power |
66599 |
66599 |
66599 |
66599 |
Power to Heat |
22274 |
22274 |
22274 |
22274 |
Solar Panel |
99606 |
99606 |
99606 |
99606 |
Solar Thermal |
14343 |
14343 |
14343 |
14343 |
Emissions Caused
cllp |
fine |
omf |
ppsa |
||
BHKW |
District Heating |
8082 |
3419 |
3419 |
3419 |
BHKW |
Low Voltage Grid |
0 |
4663 |
4663 |
4663 |
Deficit Source LV |
Low Voltage Grid |
13929 |
13929 |
13929 |
13929 |
GuD |
High Voltage Grid |
43120 |
43120 |
43120 |
43120 |
HKW |
District Heating |
294890 |
173347 |
173347 |
173347 |
HKW |
High Voltage Grid |
0 |
121544 |
121544 |
121544 |
HKW2 |
High Voltage Grid |
122738 |
122738 |
122738 |
122738 |
Congestion TransC
Integrated Global Results
IGR [€ or t_CO2] |
cllp |
fine |
omf |
ppsa |
capex (ppcd) |
0 |
0 |
0 |
0 |
costs (sim) |
315601734 |
315601734 |
315601734 |
315601734 |
emissions (sim) |
476089 |
449817 |
476089 |
449817 |
opex (ppcd) |
315601732 |
315601732 |
315601732 |
315601732 |

Summed Loads
cllp |
fine |
omf |
ppsa |
||
BHKW |
District Heating |
218805 |
218805 |
218805 |
218805 |
BHKW |
Low Voltage Grid |
138857 |
138857 |
138857 |
138857 |
Biogas |
BHKW |
420778 |
420778 |
420778 |
420778 |
Biogas plant |
Biogas |
420778 |
420778 |
420778 |
420778 |
Coal Supply |
Coal Supply Line |
709038 |
709038 |
709038 |
709038 |
Coal Supply Line |
HKW |
652109 |
652109 |
652109 |
652109 |
Coal Supply Line |
HKW2 |
56929 |
56929 |
56929 |
56929 |
Deficit Source LV |
Low Voltage Grid |
301704 |
301704 |
301704 |
301704 |
Deficit Source MV |
Medium Voltage Grid |
31460 |
31460 |
31460 |
31460 |
District Heating |
District Heating Demand |
865460 |
865460 |
865460 |
865460 |
HKW |
District Heating |
391266 |
391266 |
391266 |
391266 |
HKW |
High Voltage Grid |
156506 |
156506 |
156506 |
156506 |
HKW2 |
High Voltage Grid |
24479 |
24479 |
24479 |
24479 |
High Medium Transfer |
Medium Voltage Grid |
450363 |
450363 |
450363 |
450363 |
High Voltage Grid |
Excess Sink HV |
6546 |
6546 |
6546 |
6546 |
High Voltage Grid |
High Medium Transfer |
484261 |
484261 |
484261 |
484261 |
Low Medium Transfer |
Medium Voltage Grid |
93716 |
93716 |
93716 |
93716 |
Low Voltage Grid |
Commercial Demand |
582460 |
582460 |
582460 |
582460 |
Low Voltage Grid |
Excess Sink LV |
20777 |
20777 |
20777 |
20777 |
Low Voltage Grid |
Household Demand |
552565 |
552565 |
552565 |
552565 |
Low Voltage Grid |
Low Medium Transfer |
100770 |
100770 |
100770 |
100770 |
Medium Low Transfer |
Low Voltage Grid |
222664 |
222664 |
222664 |
222664 |
Medium Voltage Grid |
Car charging Station |
37026 |
37026 |
37026 |
37026 |
Medium Voltage Grid |
Industrial Demand |
1229008 |
1229008 |
1229008 |
1229008 |
Medium Voltage Grid |
Medium Low Transfer |
239424 |
239424 |
239424 |
239424 |
Medium Voltage Grid |
Power to Heat |
169947 |
169947 |
169947 |
169947 |
Offshore Wind Power |
High Voltage Grid |
309822 |
309822 |
309822 |
309822 |
Onshore Wind Power |
Medium Voltage Grid |
1099866 |
1099866 |
1099866 |
1099866 |
Power to Heat |
District Heating |
169947 |
169947 |
169947 |
169947 |
Solar Panel |
Low Voltage Grid |
593347 |
593347 |
593347 |
593347 |
Solar Thermal |
District Heating |
85442 |
85442 |
85442 |
85442 |
Installed Capacities
cllp |
fine |
omf |
ppsa |
|
BHKW District Heating |
13514 |
13514 |
13514 |
13514 |
BHKW Low Voltage Grid |
8576 |
8576 |
8576 |
8576 |
Biogas plant |
25988 |
25988 |
25988 |
25988 |
Car charging Station |
3473 |
3473 |
3473 |
3473 |
Coal Supply |
102123 |
102123 |
102123 |
102123 |
Commercial Demand |
41970 |
41970 |
41970 |
41970 |
Deficit Source LV |
47364 |
47364 |
47364 |
47364 |
Deficit Source MV |
15851 |
15851 |
15851 |
15851 |
District Heating Demand |
50000 |
50000 |
50000 |
50000 |
Excess Sink HV |
2013 |
2013 |
2013 |
6546 |
Excess Sink LV |
11218 |
11218 |
11218 |
20777 |
GuD |
26742 |
26742 |
26742 |
26742 |
HKW District Heating |
61274 |
61274 |
61274 |
61274 |
HKW High Voltage Grid |
24510 |
24510 |
24510 |
24510 |
HKW2 |
43913 |
43913 |
43913 |
43913 |
High Medium Transfer |
20000 |
20000 |
20000 |
20000 |
Household Demand |
36178 |
36178 |
36178 |
36178 |
Industrial Demand |
63094 |
63094 |
63094 |
63094 |
Low Medium Transfer |
20000 |
20000 |
20000 |
20000 |
Medium High Transfer |
20000 |
20000 |
20000 |
20000 |
Medium Low Transfer |
20000 |
20000 |
20000 |
20000 |
Offshore Wind Power |
18760 |
18760 |
18760 |
18760 |
Onshore Wind Power |
66599 |
66599 |
66599 |
66599 |
Power to Heat |
21569 |
21569 |
21569 |
21569 |
Solar Panel |
99606 |
99606 |
99606 |
99606 |
Solar Thermal |
14343 |
14343 |
14343 |
14343 |
Emissions Caused
cllp |
fine |
omf |
ppsa |
||
BHKW |
District Heating |
37859 |
16017 |
16017 |
16017 |
BHKW |
Low Voltage Grid |
0 |
21842 |
21842 |
21842 |
Deficit Source LV |
Low Voltage Grid |
181022 |
181022 |
181022 |
181022 |
Deficit Source MV |
Medium Voltage Grid |
18876 |
18876 |
18876 |
18876 |
HKW |
District Heating |
195022 |
114641 |
114641 |
114641 |
HKW |
High Voltage Grid |
0 |
80382 |
80382 |
80382 |
HKW2 |
High Voltage Grid |
12573 |
12573 |
12573 |
12573 |
High Voltage Grid |
Excess Sink HV |
3927 |
0 |
3927 |
0 |
Low Voltage Grid |
Excess Sink LV |
12466 |
0 |
12466 |
0 |
TransE
Integrated Global Results
IGR [€ or t_CO2] |
cllp |
fine |
omf |
ppsa |
capex (ppcd) |
939554 |
981554 |
939554 |
939554 |
costs (sim) |
229708134 |
229750135 |
229708135 |
229708135 |
emissions (sim) |
484261 |
484261 |
484261 |
484261 |
opex (ppcd) |
228768580 |
228768581 |
228768581 |
228768581 |

Summed Loads
cllp |
fine |
omf |
ppsa |
||
BHKW |
District Heating |
30823 |
30823 |
30823 |
30823 |
BHKW |
Low Voltage Grid |
19561 |
19561 |
19561 |
19561 |
Biogas |
BHKW |
59275 |
59275 |
59275 |
59275 |
Biogas plant |
Biogas |
59275 |
59275 |
59275 |
59275 |
Coal Supply |
Coal Supply Line |
1541802 |
1541802 |
1541802 |
1541802 |
Coal Supply Line |
HKW |
1012523 |
1012523 |
1012523 |
1012523 |
Coal Supply Line |
HKW2 |
529279 |
529279 |
529279 |
529279 |
Deficit Source LV |
Low Voltage Grid |
6910 |
6910 |
6910 |
6910 |
District Heating |
District Heating Demand |
865460 |
865460 |
865460 |
865460 |
Gas Station |
Gaspipeline |
277364 |
277364 |
277364 |
0 |
Gaspipeline |
GuD |
277364 |
277364 |
277364 |
0 |
GuD |
High Voltage Grid |
163645 |
163645 |
163645 |
163645 |
HKW |
District Heating |
607514 |
607514 |
607514 |
607514 |
HKW |
High Voltage Grid |
243006 |
243006 |
243006 |
243006 |
HKW2 |
High Voltage Grid |
227590 |
227590 |
227590 |
227590 |
High Medium Transfer |
Medium Voltage Grid |
877978 |
877978 |
877978 |
877978 |
High Voltage Grid |
High Medium Transfer |
944062 |
944062 |
944062 |
944062 |
Low Medium Transfer |
Medium Voltage Grid |
103346 |
103346 |
103346 |
103346 |
Low Voltage Grid |
Commercial Demand |
582460 |
582460 |
582460 |
582460 |
Low Voltage Grid |
Household Demand |
552565 |
552565 |
552565 |
552565 |
Low Voltage Grid |
Low Medium Transfer |
111125 |
111125 |
111125 |
111125 |
Medium Low Transfer |
Low Voltage Grid |
626332 |
626332 |
626332 |
626332 |
Medium Voltage Grid |
Car charging Station |
37026 |
37026 |
37026 |
37026 |
Medium Voltage Grid |
Industrial Demand |
1229008 |
1229008 |
1229008 |
1229008 |
Medium Voltage Grid |
Medium Low Transfer |
673475 |
673475 |
673475 |
673475 |
Medium Voltage Grid |
Power to Heat |
141681 |
141681 |
141681 |
141681 |
Offshore Wind Power |
High Voltage Grid |
309822 |
309822 |
309822 |
309822 |
Onshore Wind Power |
Medium Voltage Grid |
1099866 |
1099866 |
1099866 |
1099866 |
Power to Heat |
District Heating |
141681 |
141681 |
141681 |
141681 |
Solar Panel |
Low Voltage Grid |
593347 |
593347 |
593347 |
593347 |
Solar Thermal |
District Heating |
85442 |
85442 |
85442 |
85442 |
Installed Capacities
cllp |
fine |
omf |
ppsa |
|
BHKW District Heating |
13514 |
13514 |
13514 |
13514 |
BHKW Low Voltage Grid |
8576 |
8576 |
8576 |
8576 |
Biogas plant |
25988 |
25988 |
25988 |
25988 |
Car charging Station |
3473 |
3473 |
3473 |
3473 |
Coal Supply |
102123 |
102123 |
102123 |
102123 |
Commercial Demand |
41970 |
41970 |
41970 |
41970 |
Deficit Source LV |
6910 |
6910 |
6910 |
6910 |
District Heating Demand |
50000 |
50000 |
50000 |
50000 |
Gas Station |
45325 |
45325 |
45325 |
0 |
GuD |
26742 |
26742 |
26742 |
26742 |
HKW District Heating |
61274 |
61274 |
61274 |
61274 |
HKW High Voltage Grid |
24510 |
24510 |
24510 |
24510 |
HKW2 |
43913 |
43913 |
43913 |
43913 |
High Medium Transfer |
69567 |
69567 |
69567 |
69567 |
Household Demand |
36178 |
36178 |
36178 |
36178 |
Industrial Demand |
63094 |
63094 |
63094 |
63094 |
Low Medium Transfer |
30433 |
30433 |
30433 |
30433 |
Medium High Transfer |
1 |
1 |
1 |
1 |
Medium Low Transfer |
53955 |
53955 |
53955 |
53955 |
Offshore Wind Power |
18760 |
18760 |
18760 |
18760 |
Onshore Wind Power |
66599 |
66599 |
66599 |
66599 |
Power to Heat |
22274 |
22274 |
22274 |
22274 |
Solar Panel |
99606 |
99606 |
99606 |
99606 |
Solar Thermal |
14343 |
14343 |
14343 |
14343 |
Emissions Caused
cllp |
fine |
omf |
ppsa |
||
BHKW |
District Heating |
5333 |
2256 |
2256 |
2256 |
BHKW |
Low Voltage Grid |
0 |
3077 |
3077 |
3077 |
Deficit Source LV |
Low Voltage Grid |
4146 |
4146 |
4146 |
4146 |
GuD |
High Voltage Grid |
55083 |
55083 |
55083 |
55083 |
HKW |
District Heating |
302809 |
178002 |
178002 |
178002 |
HKW |
High Voltage Grid |
0 |
124808 |
124808 |
124808 |
HKW2 |
High Voltage Grid |
116890 |
116890 |
116890 |
116890 |
Further Analysis Selection
Following remarks can be made after preliminary results analysis for each of the investigated model scenario combinations.
CompCnE
The Component Comittment results of all softwares are well within a range of deviation less than 10%. This includes integrated global results, capacities installed and summed up load results but excludes total emissions caused. Since the latter has no senodary impact on other system behaviour due to no emission limit imposed, overall comparison relevant results resemble closely.
The Component Expansion results on the other hand differ substantially between
PyPSA and the remaining softwares. Whereas the results for Calliope,
FINE and oemof are again well within a range of deviation less than 10%.
This includes all the investigated preliminary results (IGR, installed
capacities, summemd up loads, eissions caused). Indicating that a closer
comparison between one of the other tools and PyPSA seems sensible. The
amount of deviation however, suggests significant discrepancies, most likely
beeing identifiable without utilizing the finer grained comparative analysis
strategy proposed in this thesis.
Comparing the summed loads and installed capacities of the Hard Coal CHP
and the Biogas CHP component in conjunction with the installed capacity
of the Heat Storage component indicate, that PyPSA does not interpet
emission allocation to CHP coompents as designed by Tessif. Likely making
the use of the overall more energy efficient combined heat and power
generation, in conjunction with non cyclic state of charge constraints,
preferable.
The plausiblity check as well as the tabular parameter comparison of the
Hard Coal CHP, the Biogas CHP and the Heat Storage done in the
Comparative Result Analysis were able to verify or
at least plausify this theory. So that for further analysis an additional
optimization is performed labeled as modified CompE where emissions
are allocated to hard coal and biogas supply lines so that PyPSA can
correctly interpret Tessif's intend.
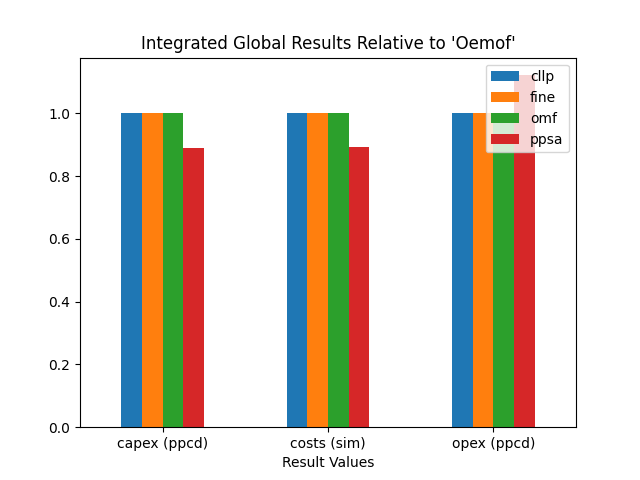
Modified CompE
As described above the modified CompE model-scenario-combination reallocates
CHP component relevant emissions to their respective commidity supply line so
that PyPSA is able to correctly interpret Tessif’s intend in this
regard.
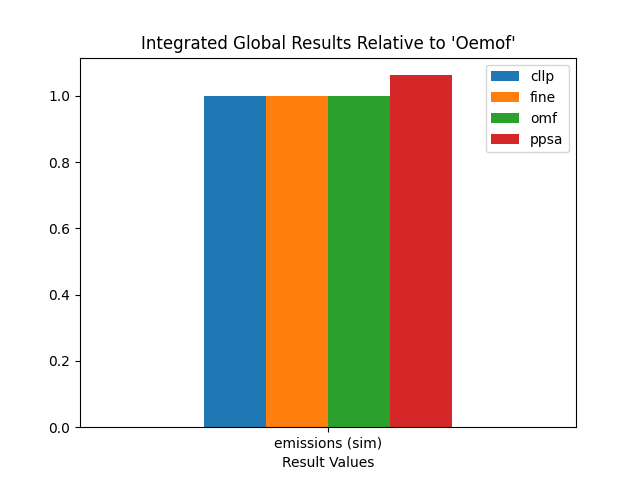
As indicated by the integrated global results, still some deviations remain.
PyPSA's total emission results are still 1.06 times that of oemof
while overall costs are only still about 89% of that of oemof. Hence
further investigations are recommended most likely revolving around the
Battery component judging from the total component emissions diagram.
If the recommended comparative result analysis was not to be conducted (e.g.
for technical reasons or reasons of brevity), the method propses the
investigation of relative differences. In this case however, they would probably
not result in any further valuable insight. Since the root cause seems to be a
minor deviation within the PyPSA storage component behaviour, a
plausiblity-check as propsed in the respective method section would be advised.
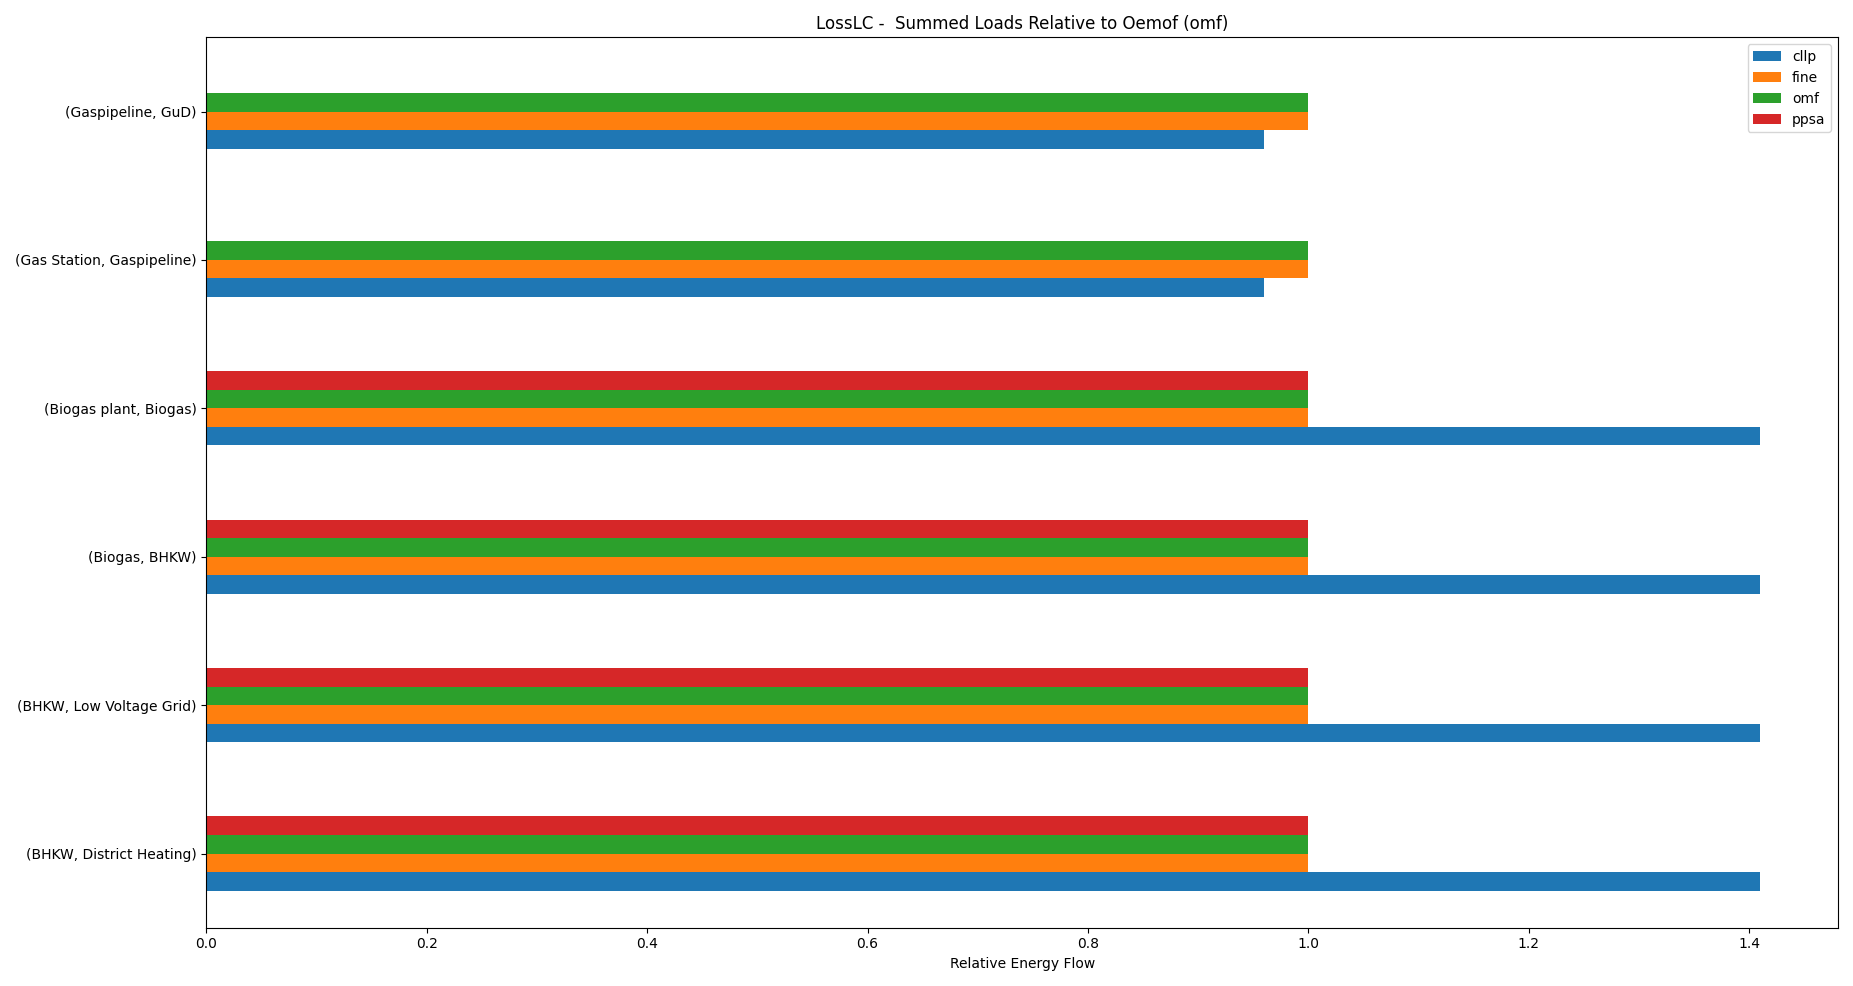
LossLC
The Lossless Comittment results of all softwares are well within a range of deviation less than 1% for the IGR, the summed up loads (except for those show below) as well as overall emissions caused.
Analysing the net energy flows where deviation is greater than 10% yields the
results shown below. Revealing that Calliope uses the Biogas commodity,
instead of the Gas commodity. If the LossLC model scenario combination was
a standalone investigation focused on the actual optimization results rather
than on their comparison, further investigations would be recommended. Since
this not the case however, and overall integrated global results resemble very
closely, no further effort is undertaken at this point.
cllp |
fine |
omf |
ppsa |
||
BHKW |
District Heating |
1.41 |
1.0 |
1.0 |
1.0 |
BHKW |
Low Voltage Grid |
1.41 |
1.0 |
1.0 |
1.0 |
Biogas |
BHKW |
1.41 |
1.0 |
1.0 |
1.0 |
Biogas plant |
Biogas |
1.41 |
1.0 |
1.0 |
1.0 |
Gas Station |
Gaspipeline |
0.96 |
1.0 |
1.0 |
0.0 |
Gaspipeline |
GuD |
0.96 |
1.0 |
1.0 |
0.0 |
TransCnE
The observed devation of the No Congestion Transformer results are less
than 5% among all results compared in the preliminary result analysis, with
the exception of the total component emissions caused, where Calliope
allocates emissions slightly differently without impacting overal emissions.
Thus, further comparative result analysis is deemed unnecessary.
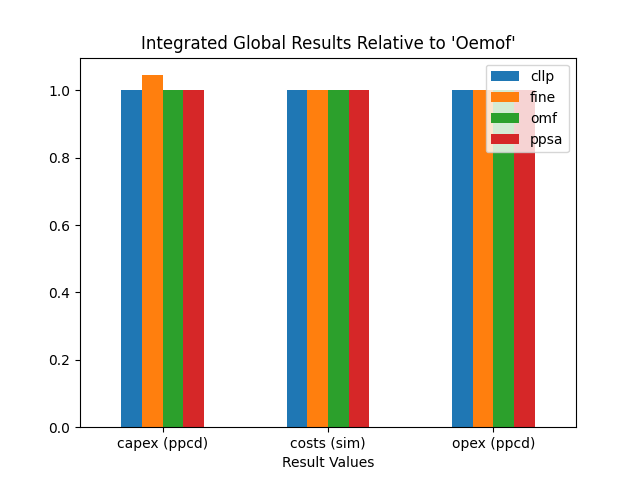
For the Congestion Transformer Commitment results total emissions vary slightly
between PyPSA and Fine as well as Oemof and Calliope due to
only the latter beeing able to allocate eissions to Sink inflows. This impacts
overall global emissions, where as the other integrated global results as well
as summed up loads do not deviate more than 1%. No
The Transformer Expansion results of all softwares are well within a range of
deviation less than 5%. This includes integrated global results, capacities
installed and summed up load results but excludes total component emissions
caused, where Calliope allocates emissions differently, however without
effecting overall emissions. Hence the results are interpreted as similar
enough to not warrent further investigations
Additional Remarks
The Congestion Transfer Commitment model scenario combination is designed to
model grid congestion effects. To counter act these, a subsequent redispatch
is necessary, which can be calculated by comparing the inflows of an
Excess Sink component and the outflows of the respective Deficit Source
component on the other side of the grid component having congestion issues.
Within the optimized timespan, two occurences of redispatch happen. Both at
the High Medum Transfer component and thus in the power flow direction
from high voltage grid to medium voltage grid. The table below lists these
congestion occurences and the subsequent redispatch necessary.
Timeseries-High Voltage Grid [MW] |
Redispatch High -> Medium |
2030-10-13 17:00:00 |
2096 |
2030-10-13 18:00:00 |
5368 |