Optimization Results
The following sections provide detailed overview on the numerical an graphical results regarding the CompCnE analysis.
Commitment
The CompC-no-congestion results generated using the respective script, are as follows:
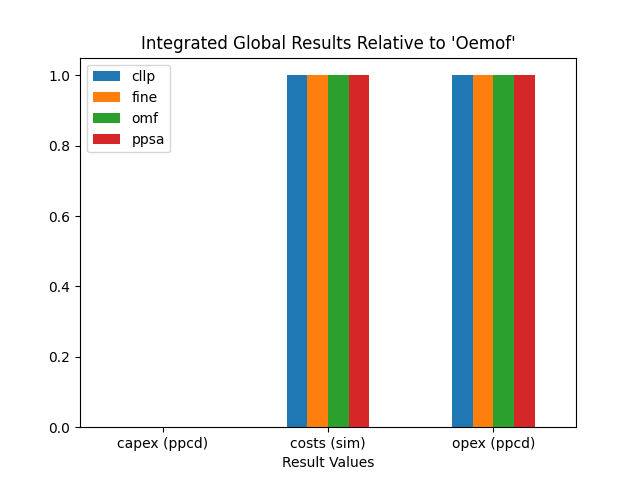
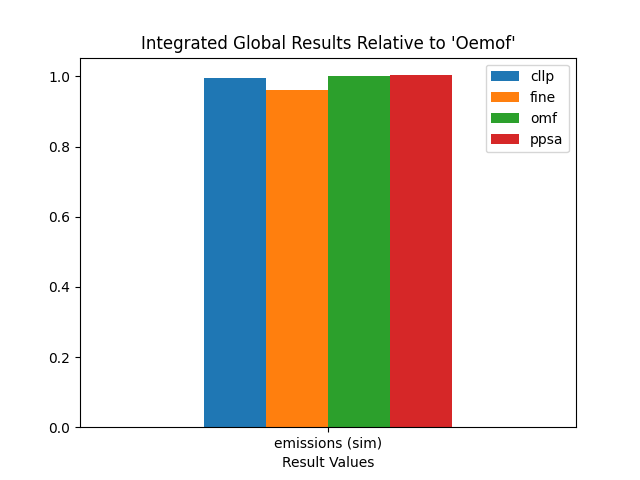
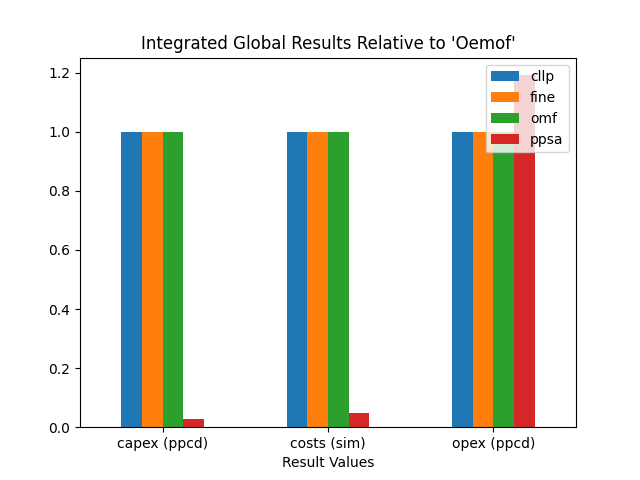
Integrated Global Results
IGR [€ or t_CO2] |
cllp |
fine |
omf |
ppsa |
capex (ppcd) |
0 |
0 |
0 |
0 |
costs (sim) |
688509346 |
688283345 |
688509325 |
688509325 |
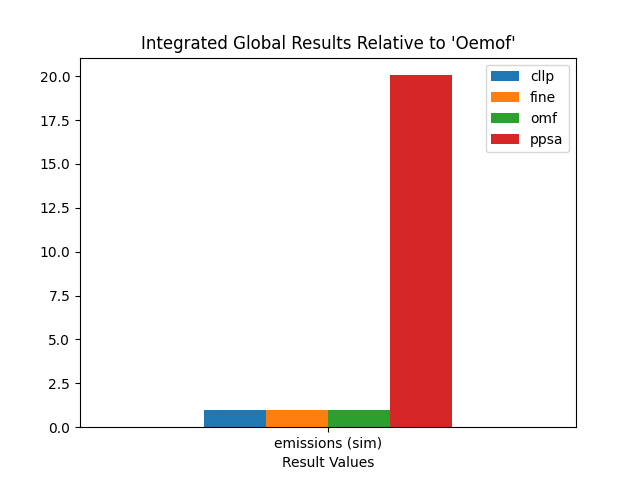
emissions (sim) |
6778376 |
6542108 |
6815007 |
6838219 |
opex (ppcd) |
688509352 |
688283344 |
688509325 |
688509325 |
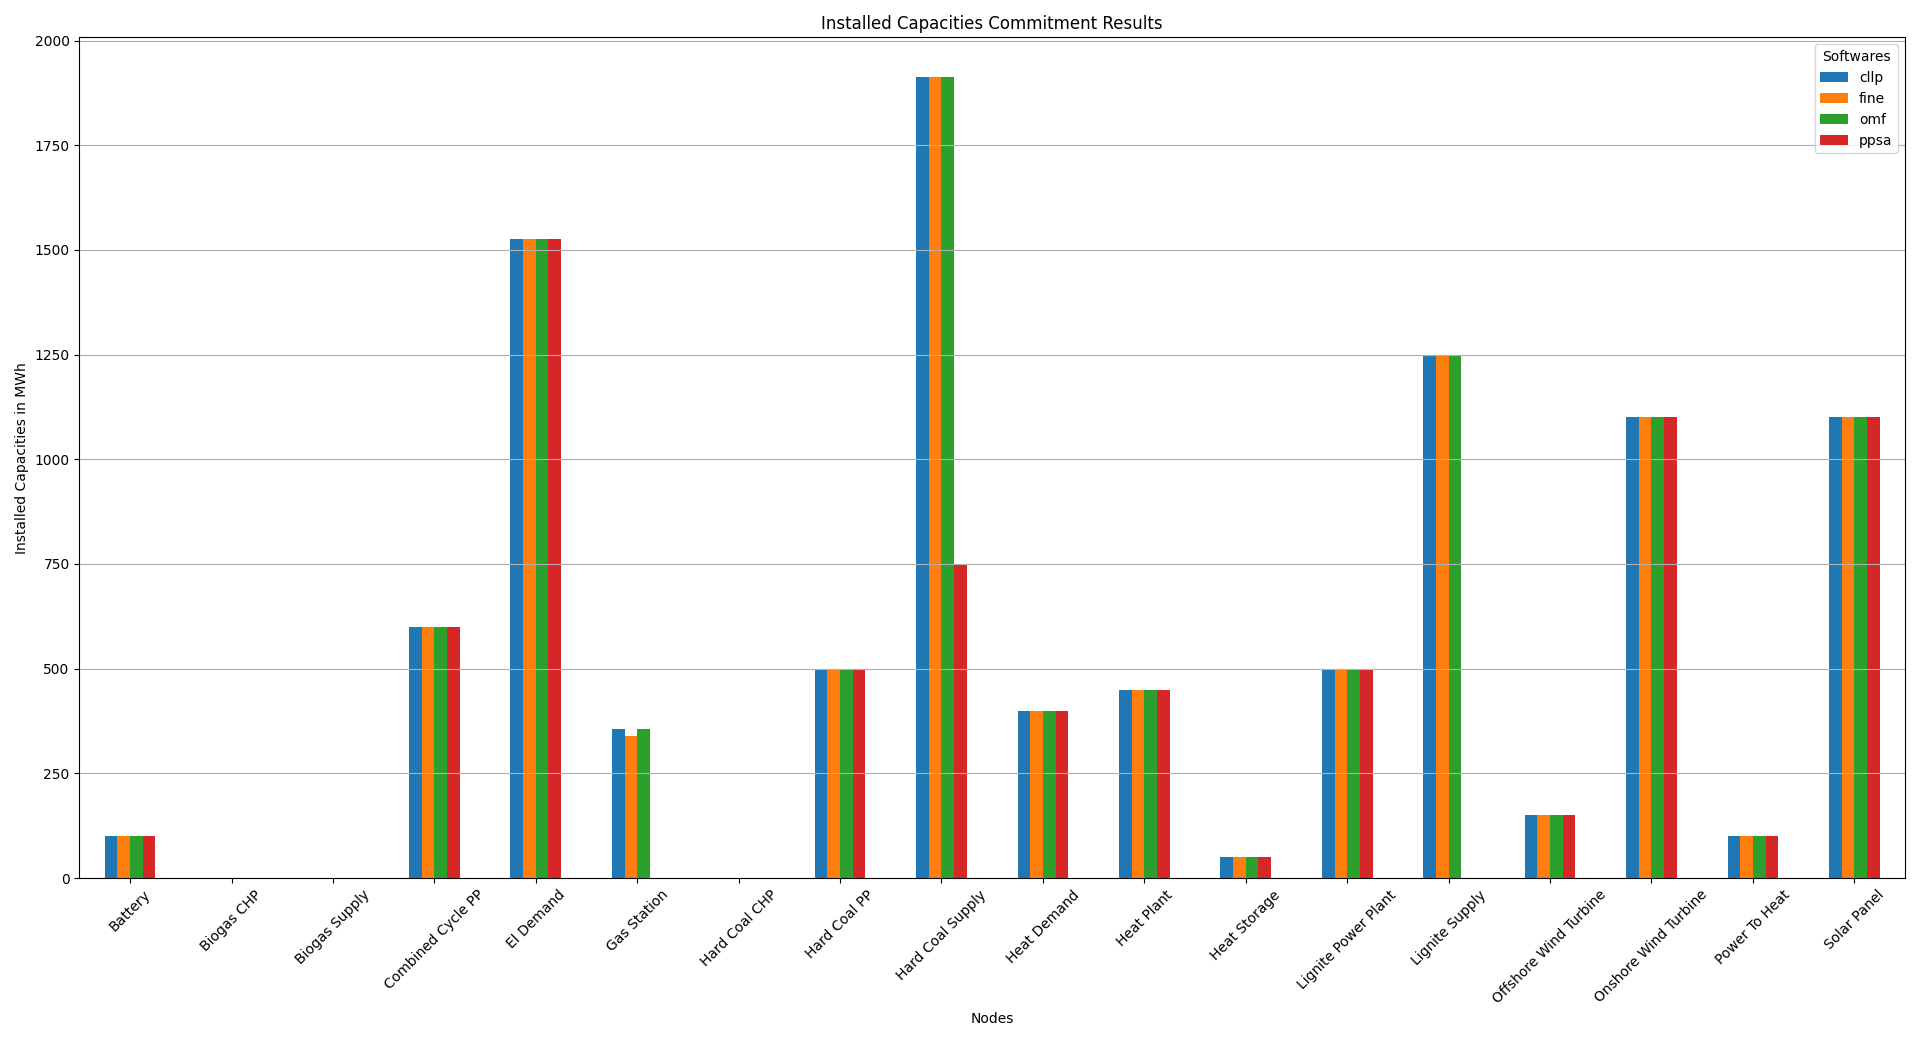
Installed Capacity
Capacity [MW or MWh] |
cllp |
fine |
omf |
ppsa |
Battery |
100 |
100 |
100 |
100 |
Biogas CHP |
[250.0, 200.0] |
[200.0, 250.0] |
[200, 250] |
[250.0, 200.0] |
Biogas Line |
variable |
variable |
variable |
variable |
Biogas Supply |
0 |
0 |
0 |
0 |
Combined Cycle PP |
600 |
600 |
600 |
600 |
El Demand |
1526 |
1526 |
1526 |
1526 |
Gas Line |
variable |
variable |
variable |
variable |
Gas Station |
357 |
340 |
357 |
variable |
Hard Coal CHP |
[300.0, 300.0] |
[300.0, 300.0] |
[300, 300] |
[300.0, 300.0] |
Hard Coal PP |
500 |
500 |
500 |
500 |
Hard Coal Supply |
1912 |
1912 |
1912 |
750 |
Hard Coal Supply Line |
variable |
variable |
variable |
variable |
Heat Demand |
399 |
399 |
399 |
399 |
Heat Plant |
450 |
450 |
450 |
450 |
Heat Storage |
50 |
50 |
50 |
50 |
Heatline |
variable |
variable |
variable |
variable |
Lignite Power Plant |
500 |
500 |
500 |
500 |
Lignite Supply |
1250 |
1250 |
1250 |
variable |
Lignite Supply Line |
variable |
variable |
variable |
variable |
Offshore Wind Turbine |
150 |
150 |
150 |
150 |
Onshore Wind Turbine |
1100 |
1100 |
1100 |
1100 |
Power To Heat |
100 |
100 |
100 |
100 |
Powerline |
variable |
variable |
variable |
variable |
Solar Panel |
1100 |
1100 |
1100 |
1100 |
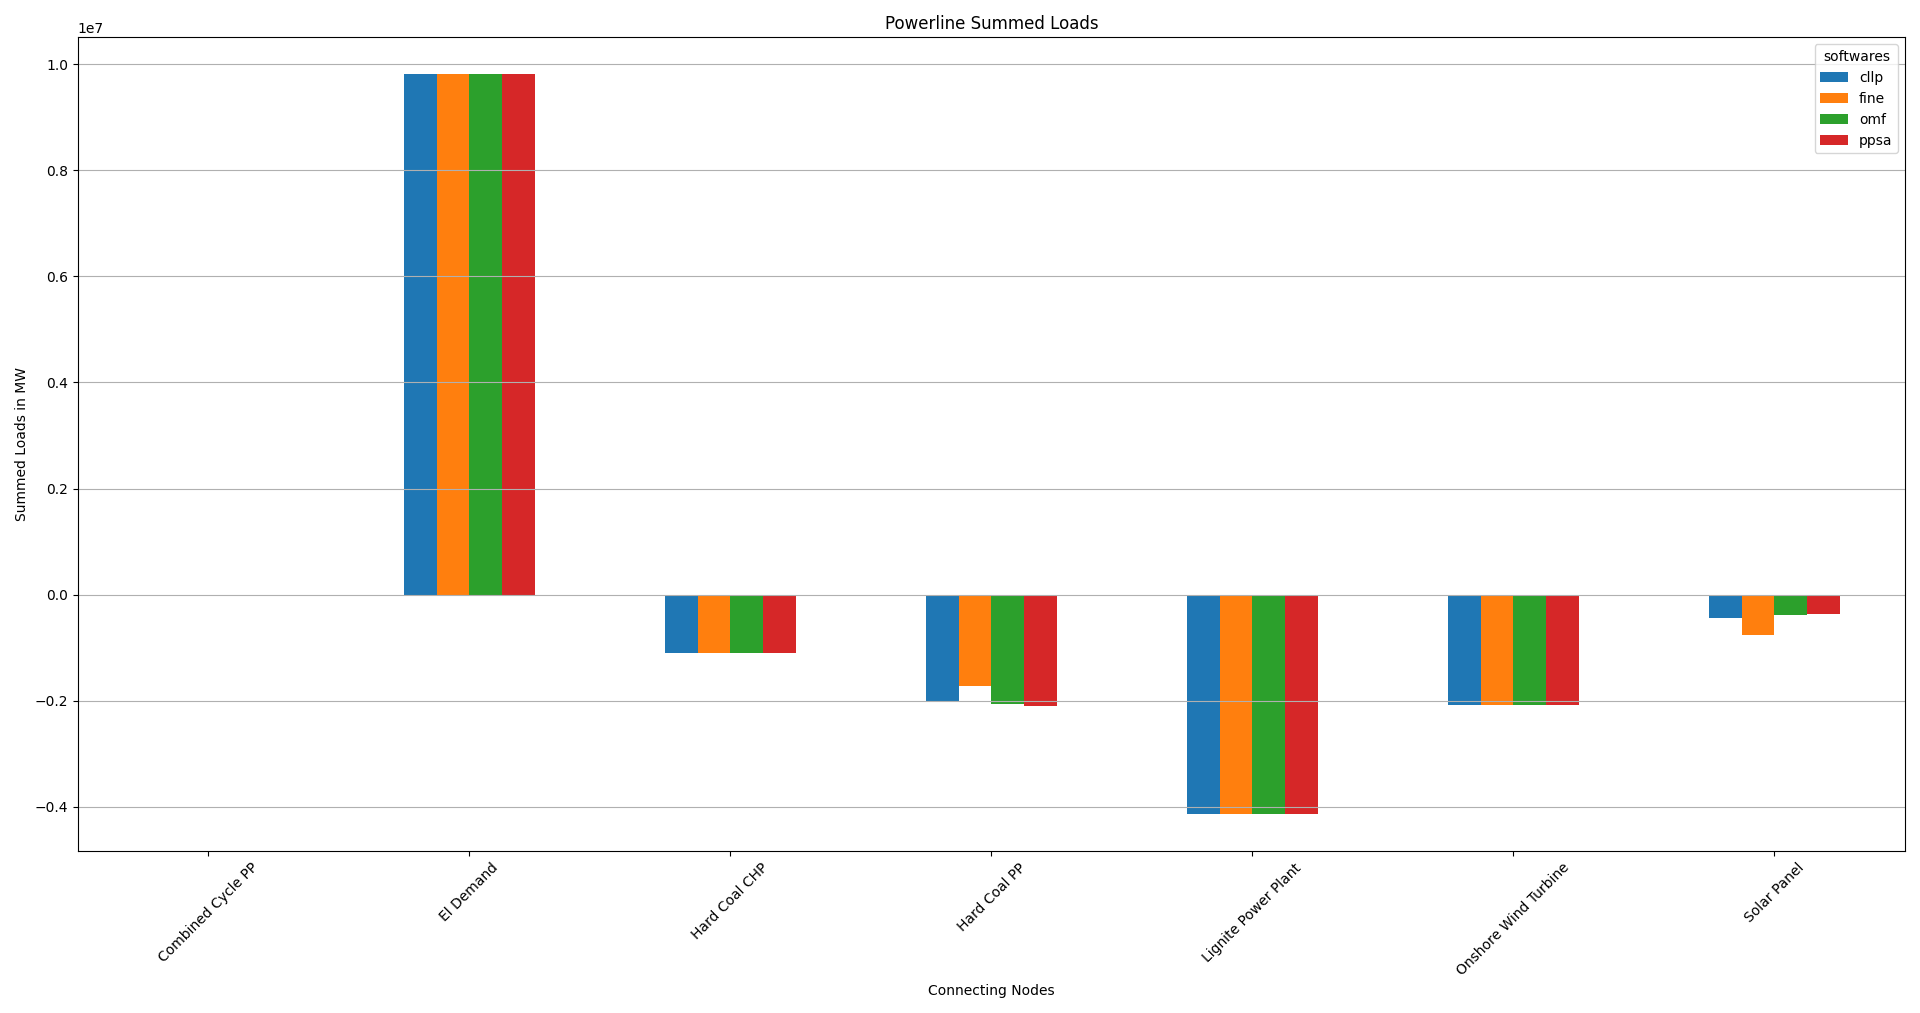
Powerline Summed Loads
Load-Powerline [MW] |
cllp |
fine |
omf |
ppsa |
Battery |
0 |
0 |
0 |
0 |
Battery |
0 |
0 |
0 |
0 |
Biogas CHP |
0 |
0 |
0 |
0 |
Combined Cycle PP |
-31949 |
-9779 |
-31949 |
-31949 |
El Demand |
9809506 |
9809506 |
9809506 |
9809506 |
Hard Coal CHP |
-1107097 |
-1106703 |
-1107094 |
-1107094 |
Hard Coal PP |
-2020952 |
-1715712 |
-2069796 |
-2100746 |
Lignite Power Plant |
-4132599 |
-4132212 |
-4132599 |
-4132599 |
Offshore Wind Turbine |
0 |
0 |
0 |
0 |
Onshore Wind Turbine |
-2081332 |
-2081336 |
-2081332 |
-2081332 |
Power To Heat |
0 |
0 |
0 |
0 |
Solar Panel |
-435574 |
-763762 |
-386733 |
-355783 |
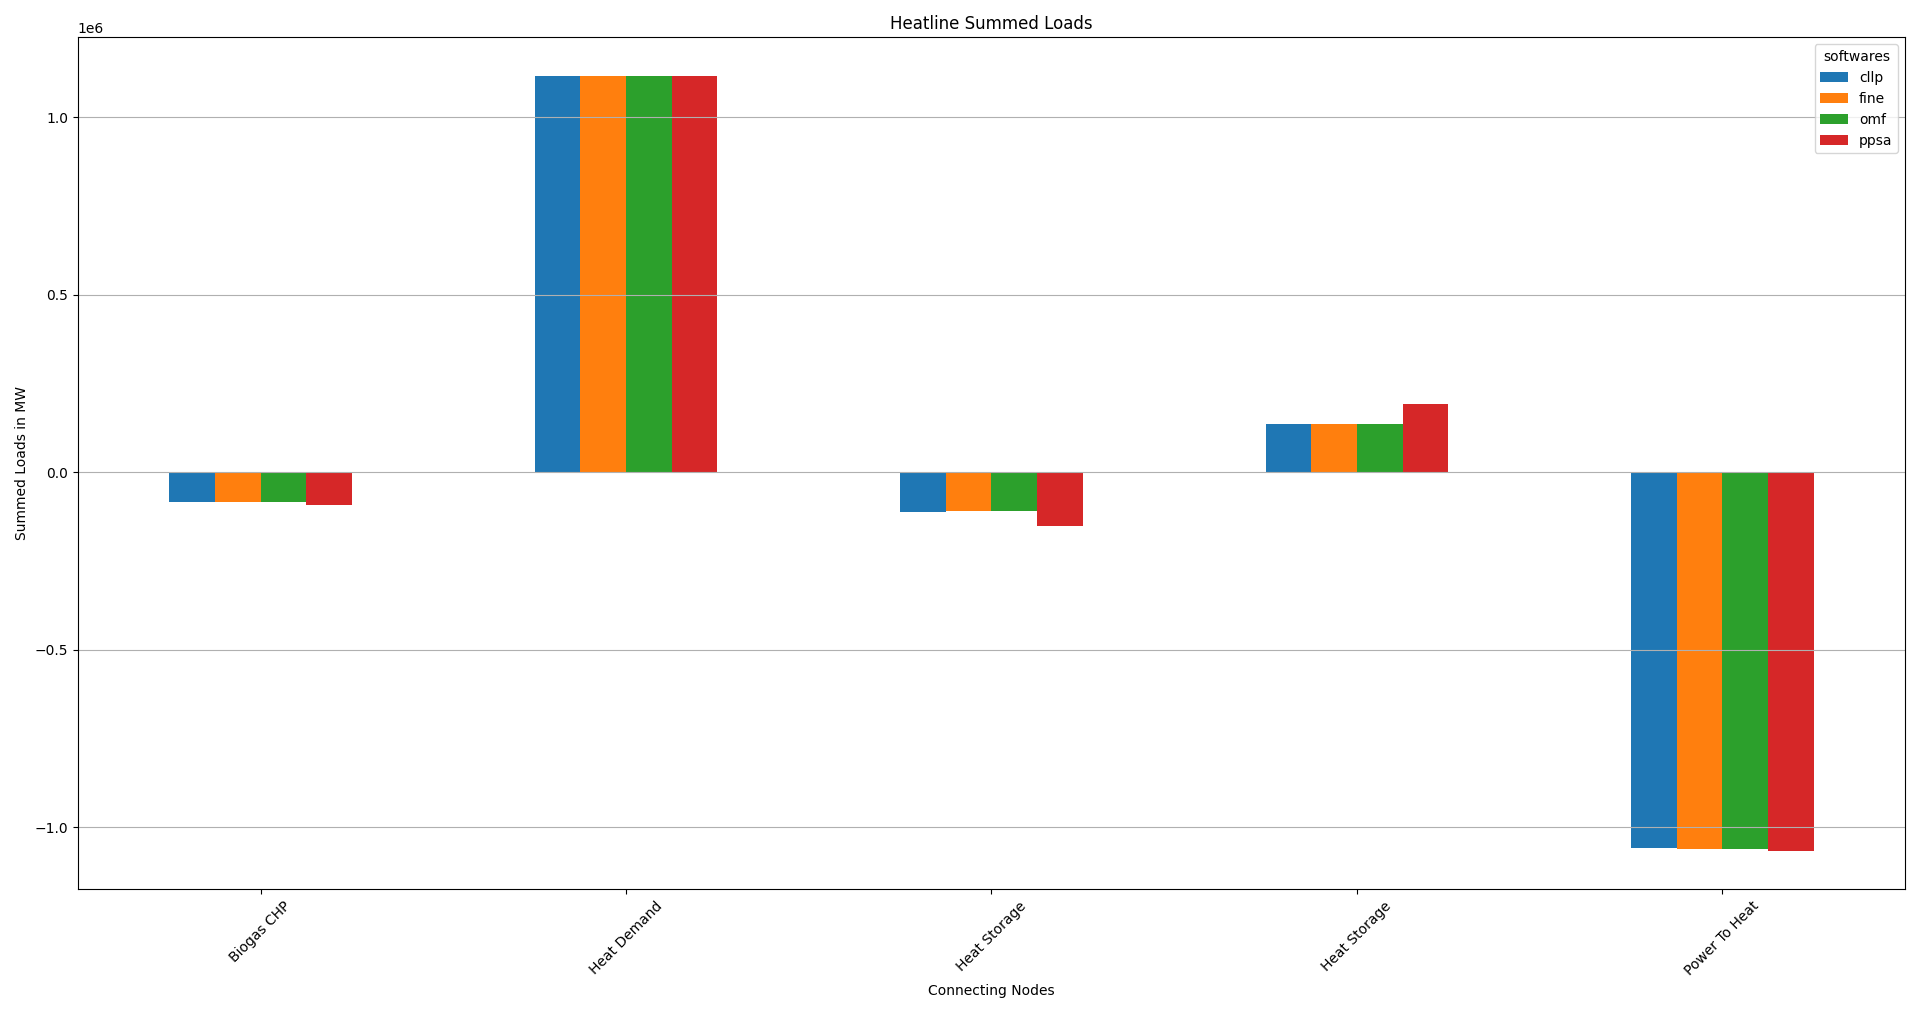
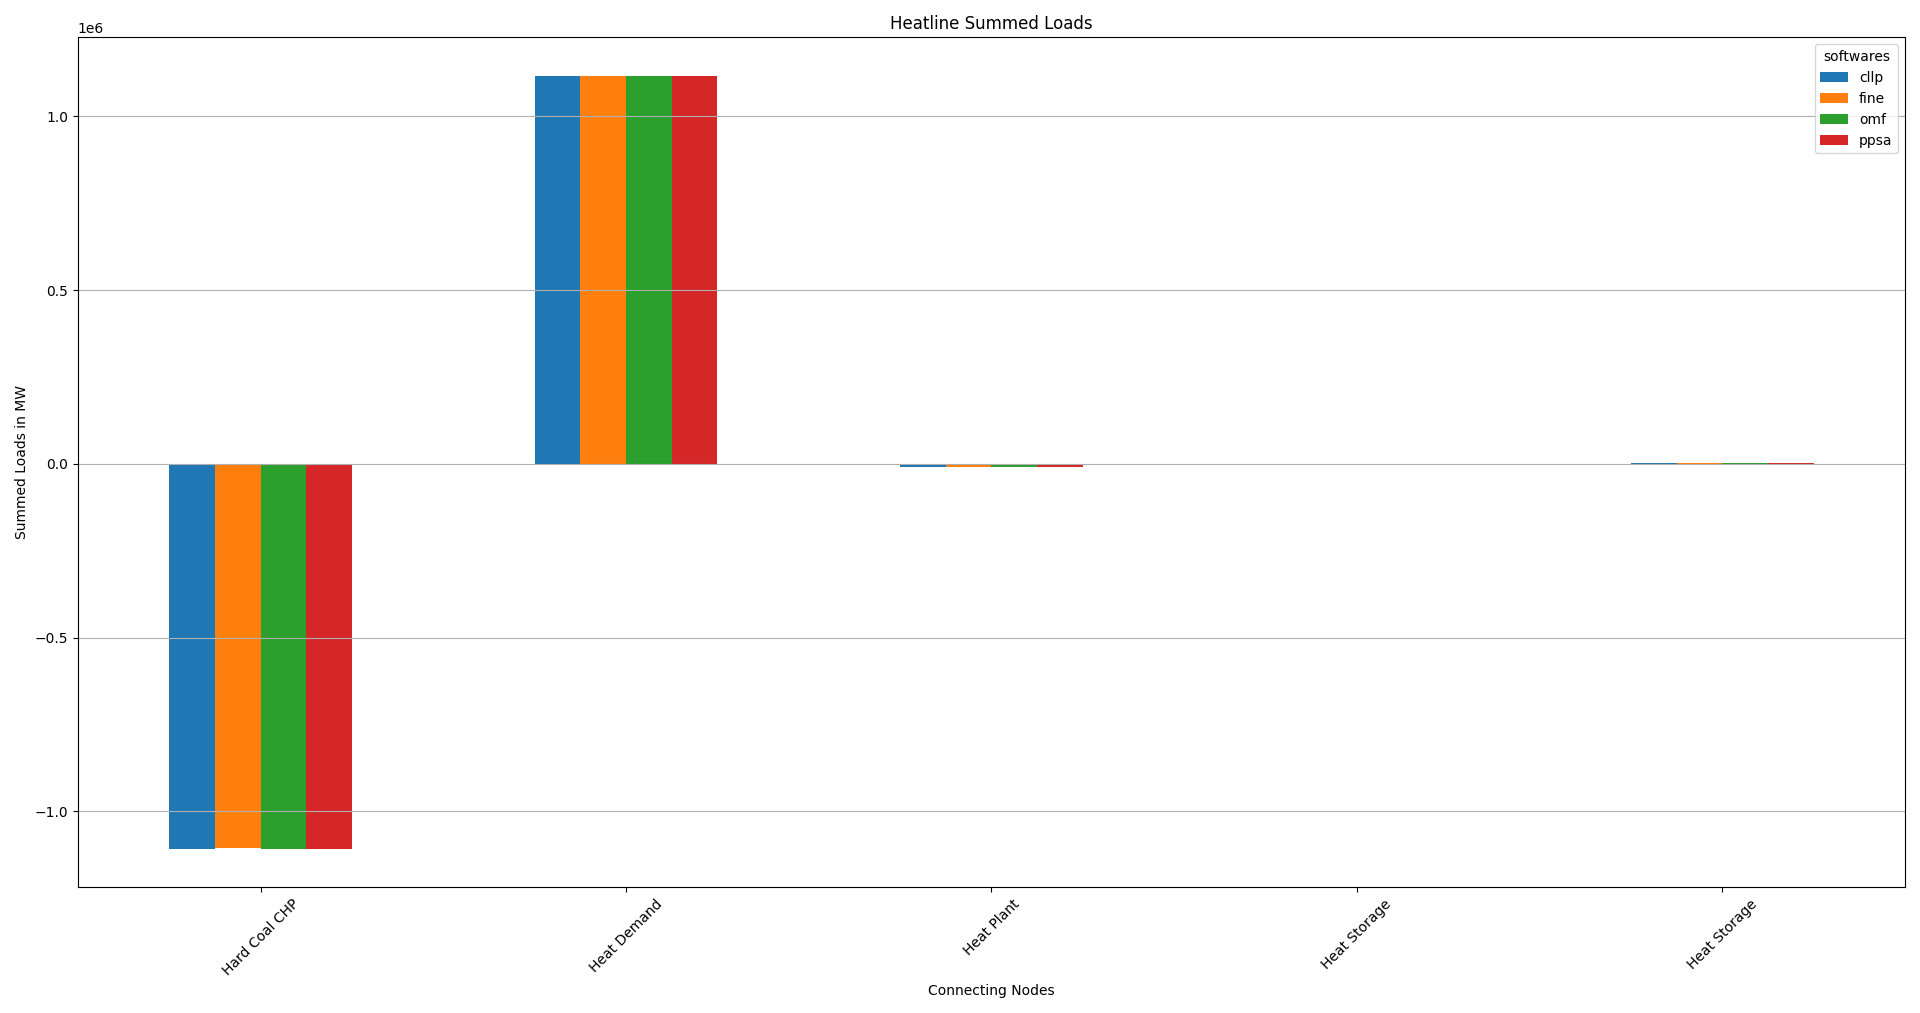
Heatline Summed Loads
Load-Heatline [MW] |
cllp |
fine |
omf |
ppsa |
Biogas CHP |
0 |
0 |
0 |
0 |
Hard Coal CHP |
-1107097 |
-1106703 |
-1107094 |
-1107094 |
Heat Demand |
1116162 |
1116162 |
1116162 |
1116162 |
Heat Plant |
-10099 |
-10099 |
-10099 |
-10099 |
Heat Storage |
-2447 |
-2064 |
-2448 |
-2448 |
Heat Storage |
3482 |
2704 |
3478 |
3478 |
Power To Heat |
0 |
0 |
0 |
0 |
Expansion
The CompE results generated using the respective script, are as follows:
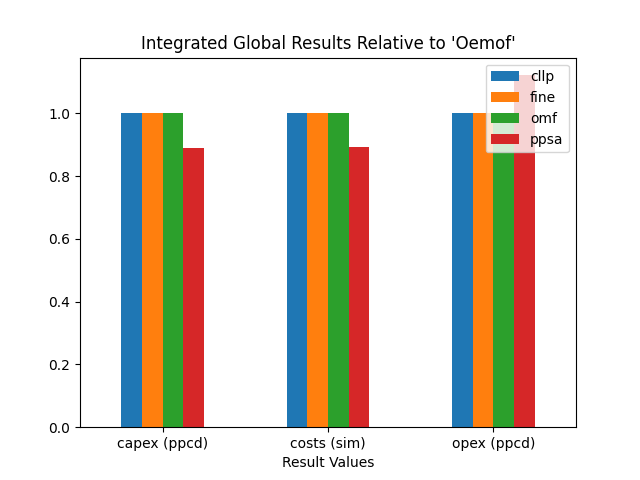
Integrated Global Results
IGR [€ or t_CO2] |
cllp |
fine |
omf |
ppsa |
capex (ppcd) |
41554917514 |
41554976118 |
41554977878 |
1132235997 |
costs (sim) |
42289121225 |
42289118279 |
42289118239 |
2062636560 |
emissions (sim) |
250000 |
250000 |
250000 |
5014819 |
opex (ppcd) |
734204228 |
734140364 |
734140364 |
874603138 |
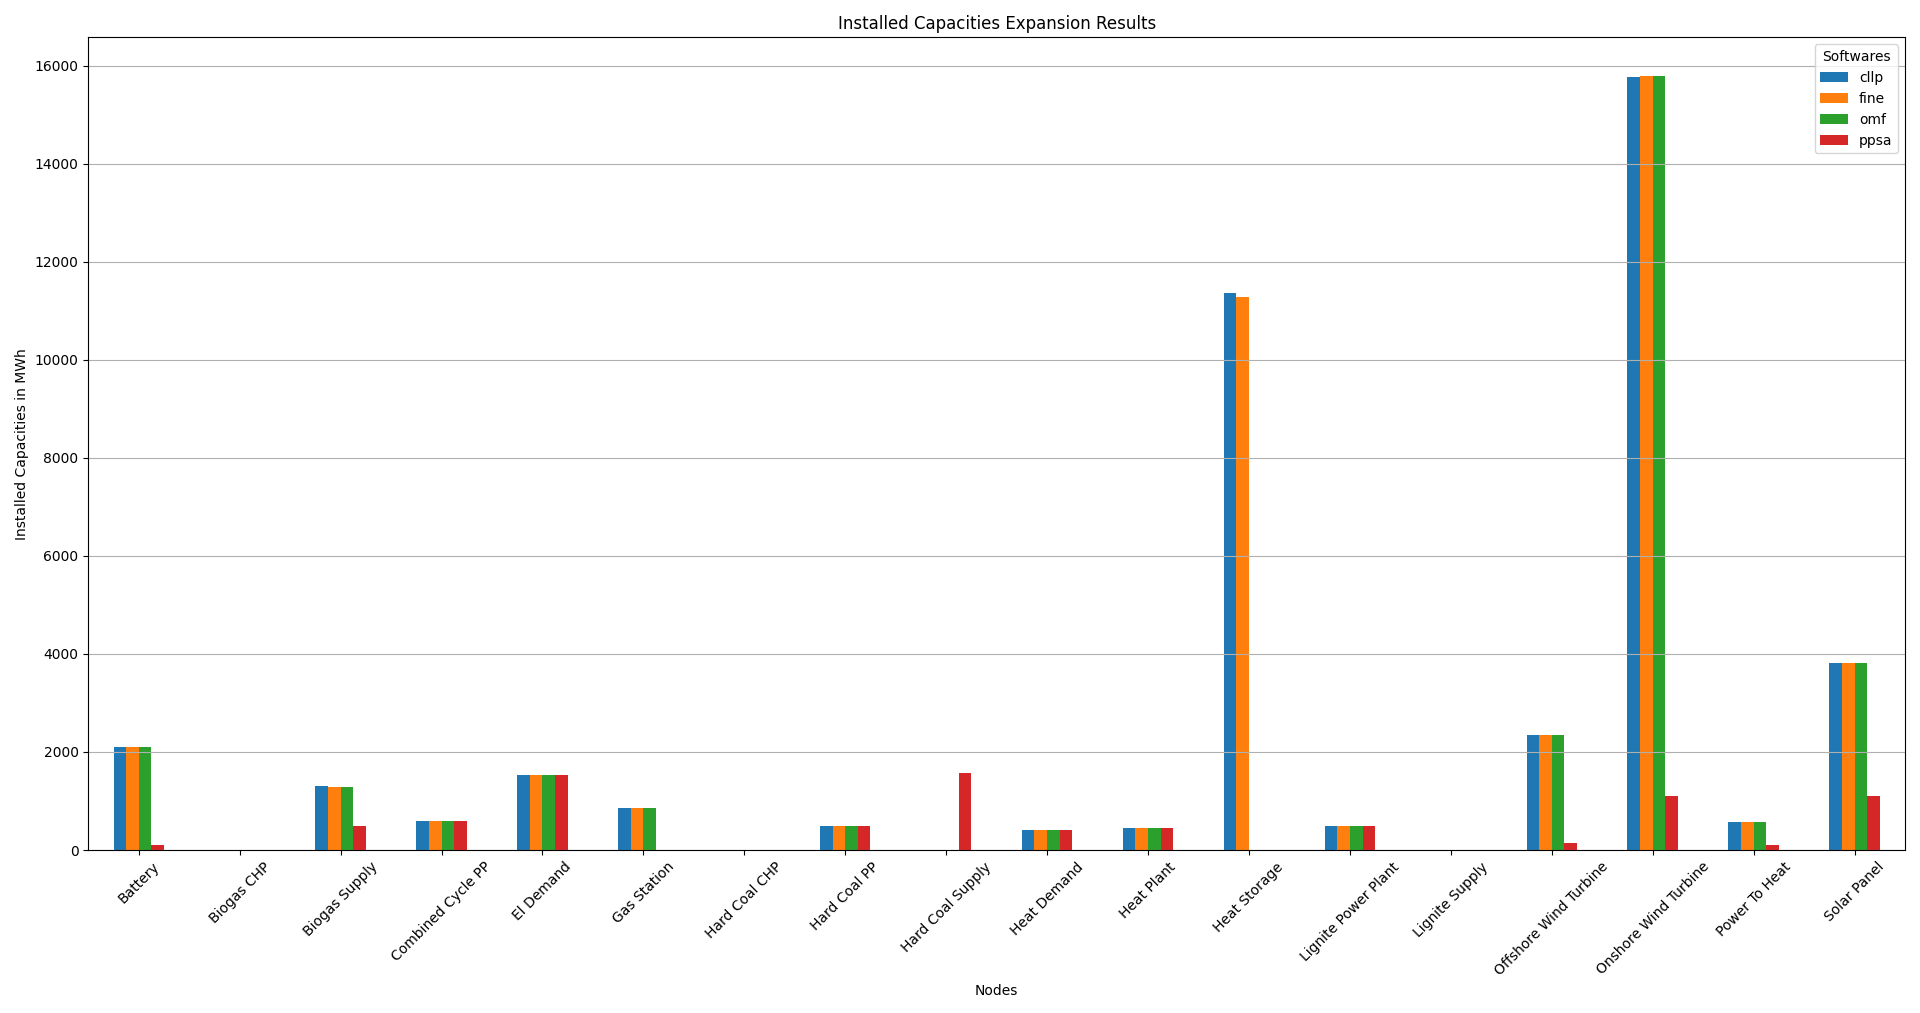
Installed Capacity
Capacity [MW or MWh] |
cllp |
fine |
omf |
ppsa |
Battery |
2104 |
2104 |
2104 |
100 |
Biogas CHP,”[649.6665625, 519.73325]”,”[516.213, 645.266]”,”[516.21323, 645.26654]”,”[250.0, 200.0]” |
||||
Biogas Line |
variable |
variable |
variable |
variable |
Biogas Supply |
1299 |
1290 |
1290 |
500 |
Combined Cycle PP |
600 |
600 |
600 |
600 |
El Demand |
1526 |
1526 |
1526 |
1526 |
Gas Line |
variable |
variable |
variable |
variable |
Gas Station |
847 |
852 |
852 |
variable |
Hard Coal CHP,”[300.0, 300.0]”,”[300.0, 300.0]”,”[300.0, 300.0]”,”[630.73628, 630.73628]” |
||||
Hard Coal PP |
500 |
500 |
500 |
500 |
Hard Coal Supply |
0 |
0 |
0 |
1576 |
Hard Coal Supply Line |
variable |
variable |
variable |
variable |
Heat Demand |
399 |
399 |
399 |
399 |
Heat Plant |
450 |
450 |
450 |
450 |
Heat Storage |
11357 |
11272 |
11272.2.3391 |
113391.86 |
Heatline |
variable |
variable |
variable |
variable |
Lignite Power Plant |
500 |
500 |
500 |
500 |
Lignite Supply |
0 |
0 |
0 |
variable |
Lignite Supply Line |
variable |
variable |
variable |
variable |
Offshore Wind Turbine |
2347 |
2346 |
2346 |
150 |
Onshore Wind Turbine |
15776 |
15787 |
15787 |
1100 |
Power To Heat |
576 |
576 |
576 |
99 |
Powerline |
variable |
variable |
variable |
variable |
Solar Panel |
3811 |
3809 |
3809 |
1100 |
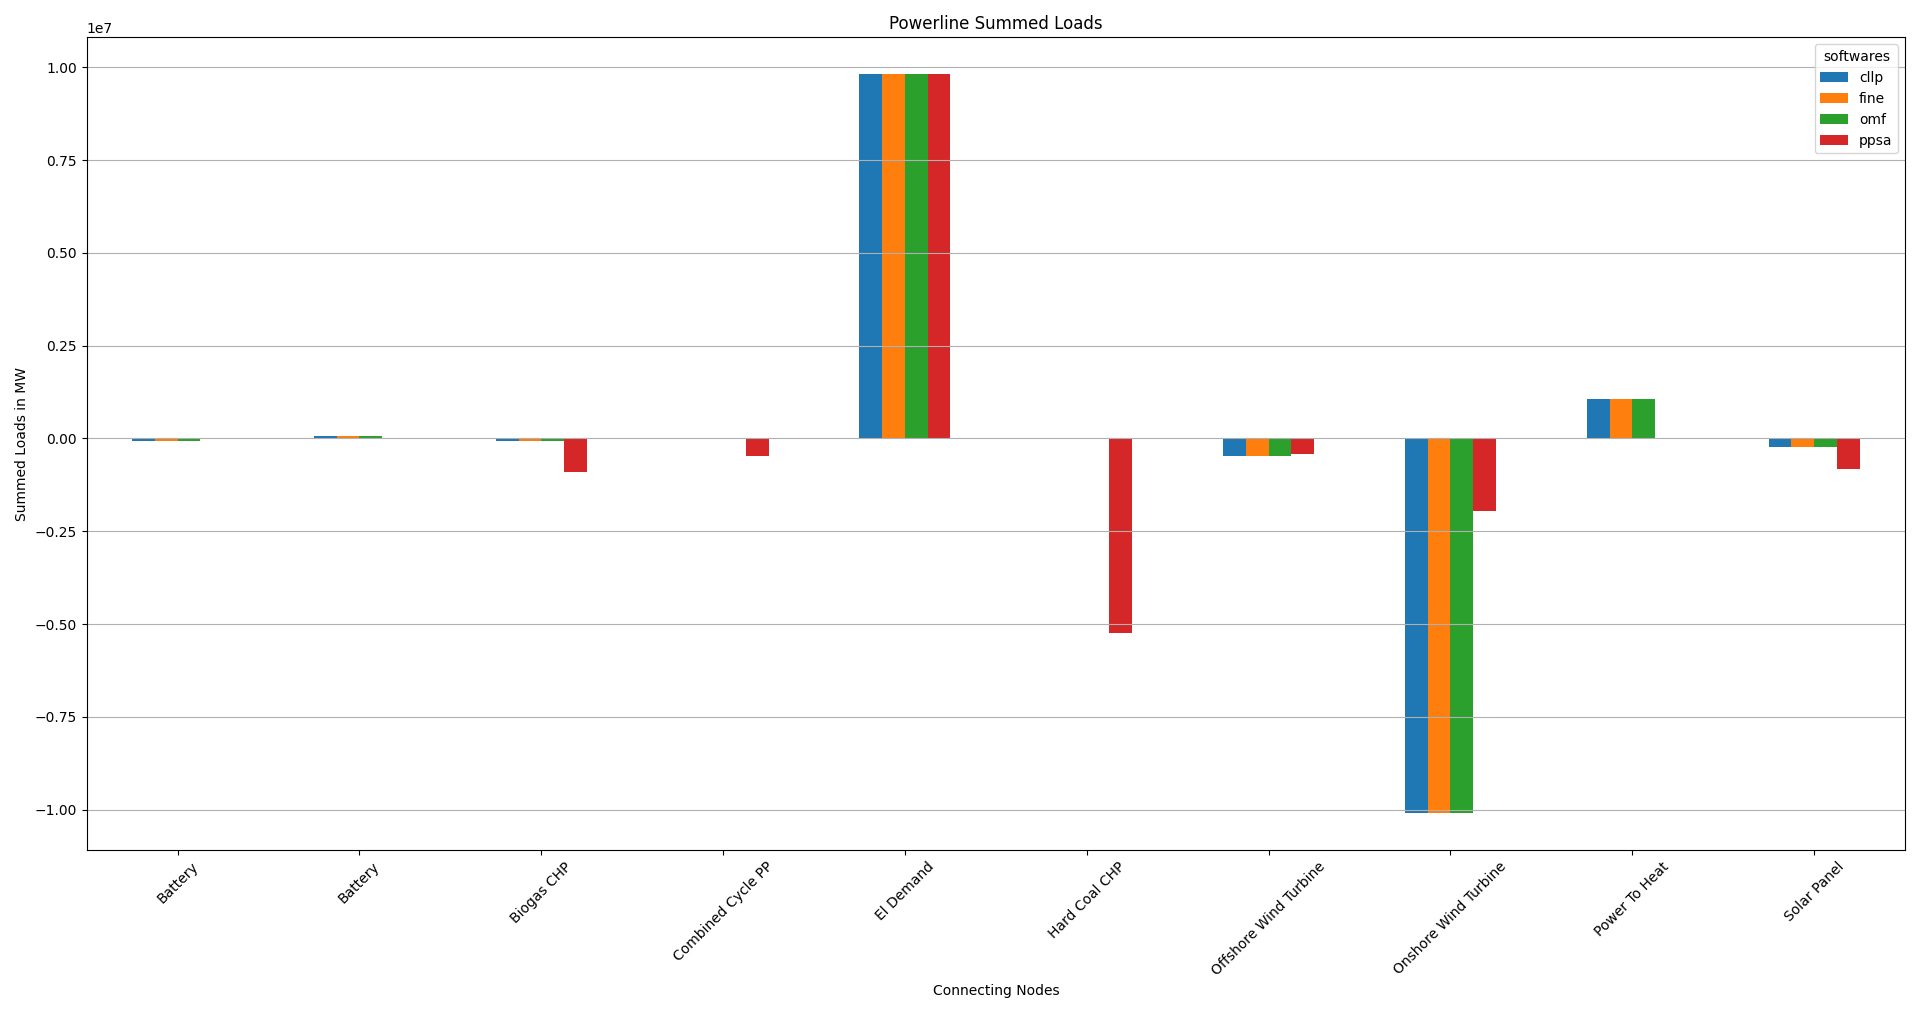
Powerline Summed Loads
Load-Powerline [MW] |
cllp |
fine |
omf |
ppsa |
Battery |
-59184 |
-59142 |
-59142 |
-16594 |
Battery |
69736 |
69681 |
69681 |
19032 |
Biogas CHP |
-66772 |
-66470 |
-66470 |
-901176 |
Combined Cycle PP |
-11270 |
-11512 |
-11512 |
-460928 |
El Demand |
9809506 |
9809506 |
9809506 |
9809506 |
Hard Coal CHP |
0 |
0 |
0 |
-5252800 |
Hard Coal PP |
0 |
0 |
0 |
0 |
Lignite Power Plant |
0 |
0 |
0 |
0 |
Offshore Wind Turbine |
-480373 |
-479668 |
-479668 |
-412888 |
Onshore Wind Turbine |
-10089236 |
-10090424 |
-10090424 |
-1959677 |
Power To Heat |
1069849 |
1070091 |
1070091 |
0 |
Solar Panel |
-242253 |
-242060 |
-242060 |
-824472 |
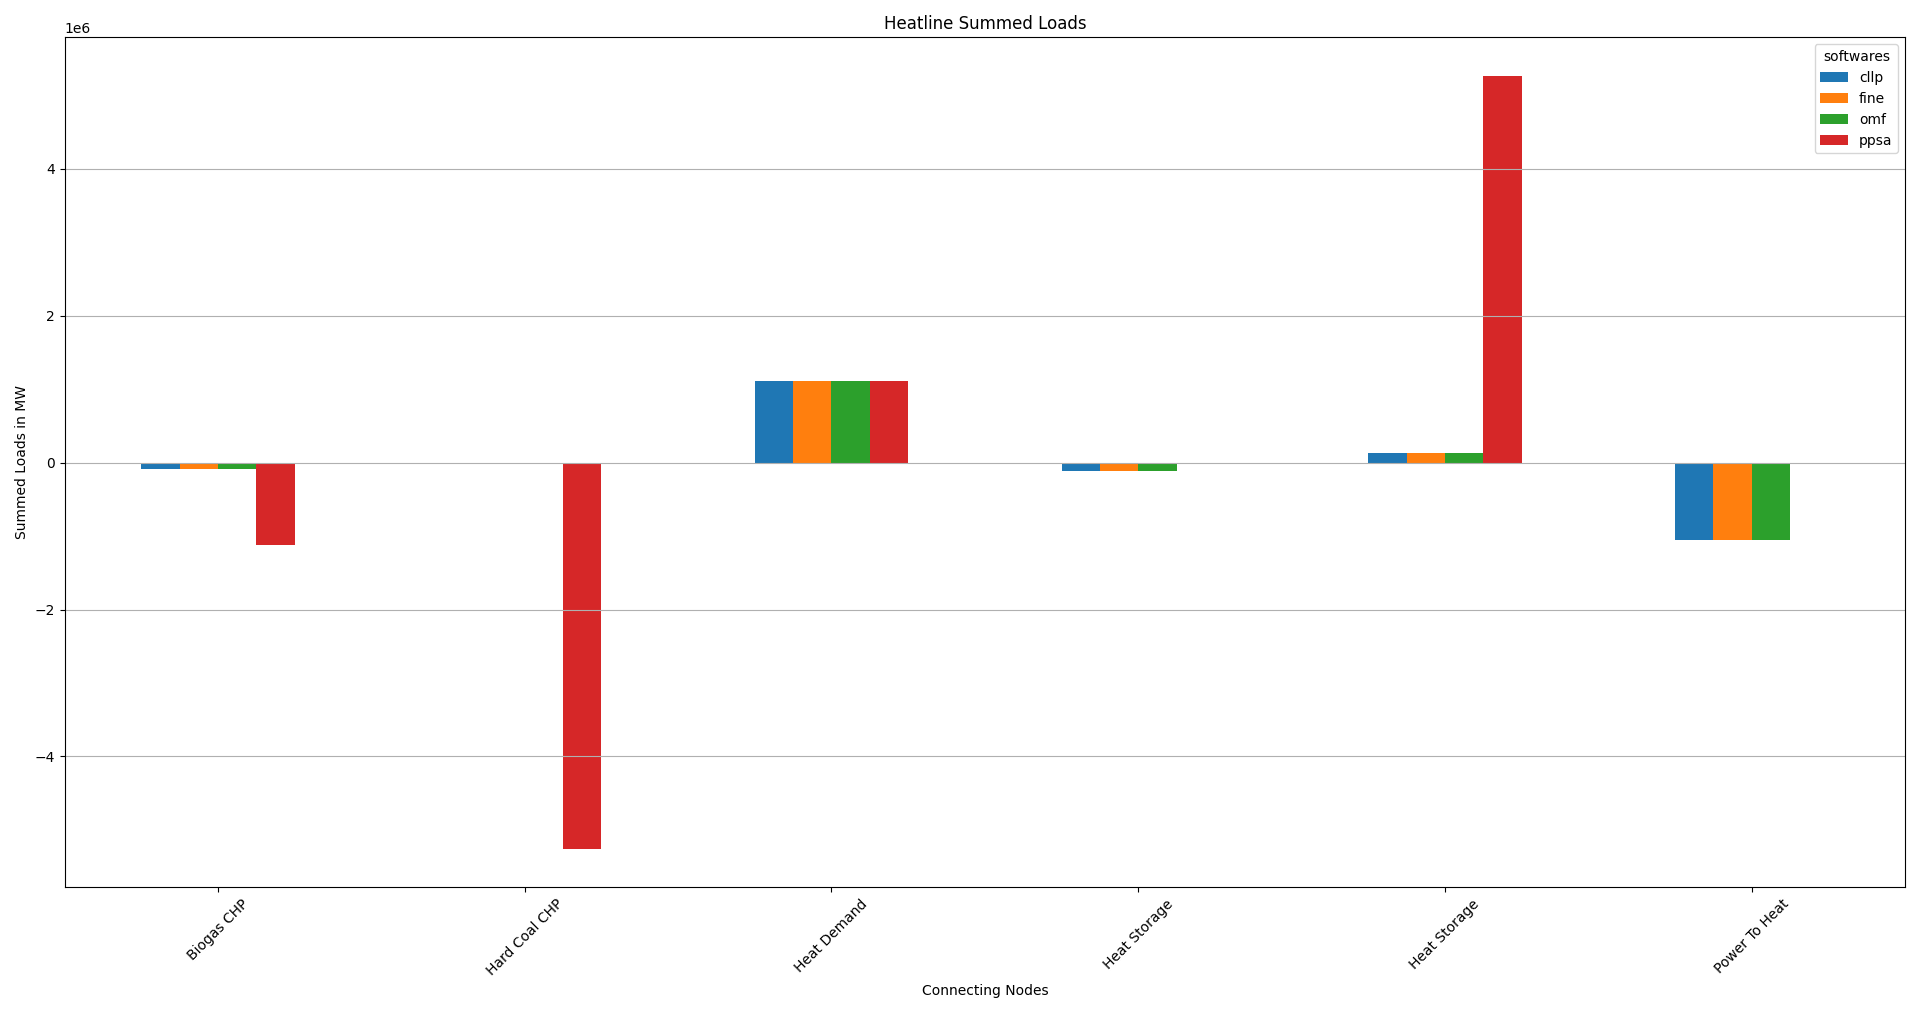
Heatline Summed Loads
Load-Heatline [MW] |
cllp |
fine |
omf |
ppsa |
Biogas CHP |
-83465 |
-83088 |
-83088 |
-1126470 |
Hard Coal CHP |
0 |
0 |
0 |
-5252800 |
Heat Demand |
1116162 |
1116162 |
1116162 |
1116162 |
Heat Plant |
0 |
0 |
0 |
0 |
Heat Storage |
-110220 |
-109928 |
-109928 |
0 |
Heat Storage |
136673 |
136245 |
136245 |
5263108 |
Power To Heat |
-1059150 |
-1059390 |
-1059390 |
0 |
Modified Expansion
The CompE results generated using the respective script, are as follows:
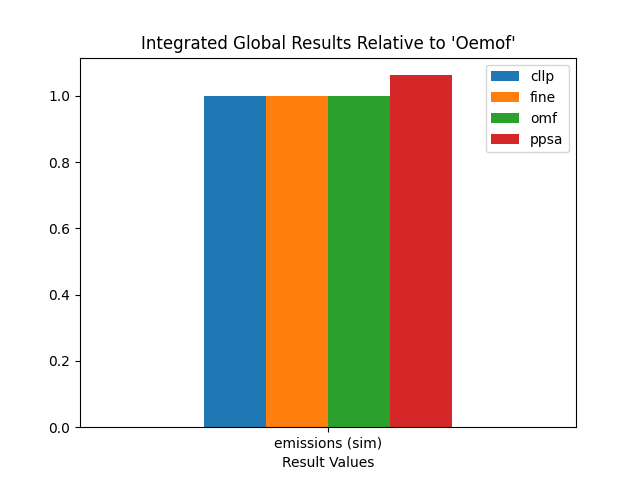
Integrated Global Results
IGR [€ or t_CO2] |
cllp |
fine |
omf |
ppsa |
capex (ppcd) |
41554917514 |
41554976118 |
41554977878 |
36904768288 |
costs (sim) |
42289121225 |
42289118279 |
42289118239 |
37727776780 |
emissions (sim) |
250000 |
250000 |
250000 |
265508 |
opex (ppcd) |
734204228 |
734140364 |
734140364 |
823007841 |
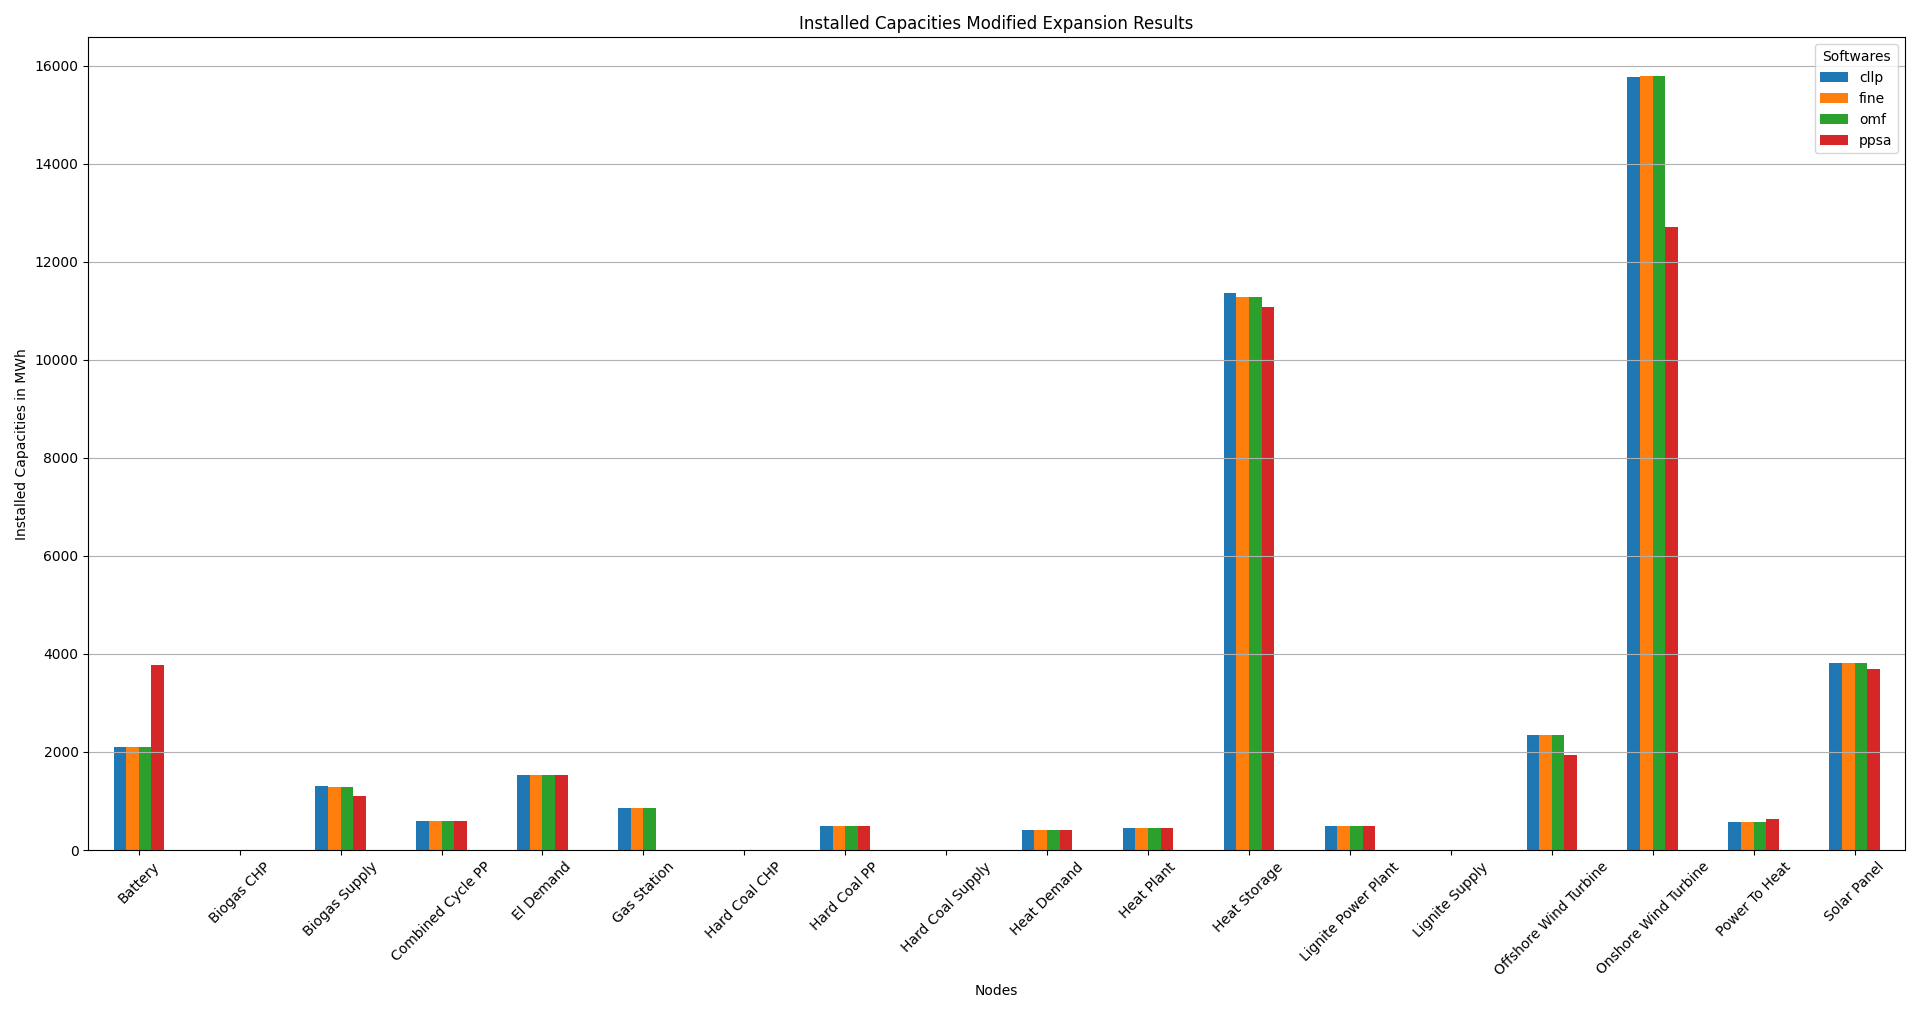
Installed Capacity
Capacity [MW or MWh] |
cllp |
fine |
omf |
ppsa |
Battery |
2104 |
2104 |
2104 |
3770 |
Biogas CHP |
[649.6665625, 519.73325] |
[645.266, 516.213] |
[516.21323, 645.26654] |
[550.4802, 440.38416] |
Biogas Line |
variable |
variable |
variable |
variable |
Biogas Supply |
1299 |
1290 |
1290 |
1100 |
Combined Cycle PP |
600 |
600 |
600 |
600 |
El Demand |
1526 |
1526 |
1526 |
1526 |
Gas Line |
variable |
variable |
variable |
variable |
Gas Station |
847 |
852 |
852 |
variable |
Hard Coal CHP |
[300.0, 300.0] |
[300.0, 300.0] |
[300.0, 300.0] |
[300.0, 300.0] |
Hard Coal PP |
500 |
500 |
500 |
500 |
Hard Coal Supply |
0 |
0 |
0 |
0 |
Hard Coal Supply Line |
variable |
variable |
variable |
variable |
Heat Demand |
399 |
399 |
399 |
399 |
Heat Plant |
450 |
450 |
450 |
450 |
Heat Storage |
11357 |
11272 |
11272 |
11082 |
Heatline |
variable |
variable |
variable |
variable |
Lignite Power Plant |
500 |
500 |
500 |
500 |
Lignite Supply |
0 |
0 |
0 |
variable |
Lignite Supply Line |
variable |
variable |
variable |
variable |
Offshore Wind Turbine |
2347 |
2346 |
2346 |
1947 |
Onshore Wind Turbine |
15776 |
15787 |
15787 |
12703 |
Power To Heat |
576 |
576 |
576 |
634 |
Powerline |
variable |
variable |
variable |
variable |
Solar Panel |
3811 |
3809 |
3809 |
3684 |
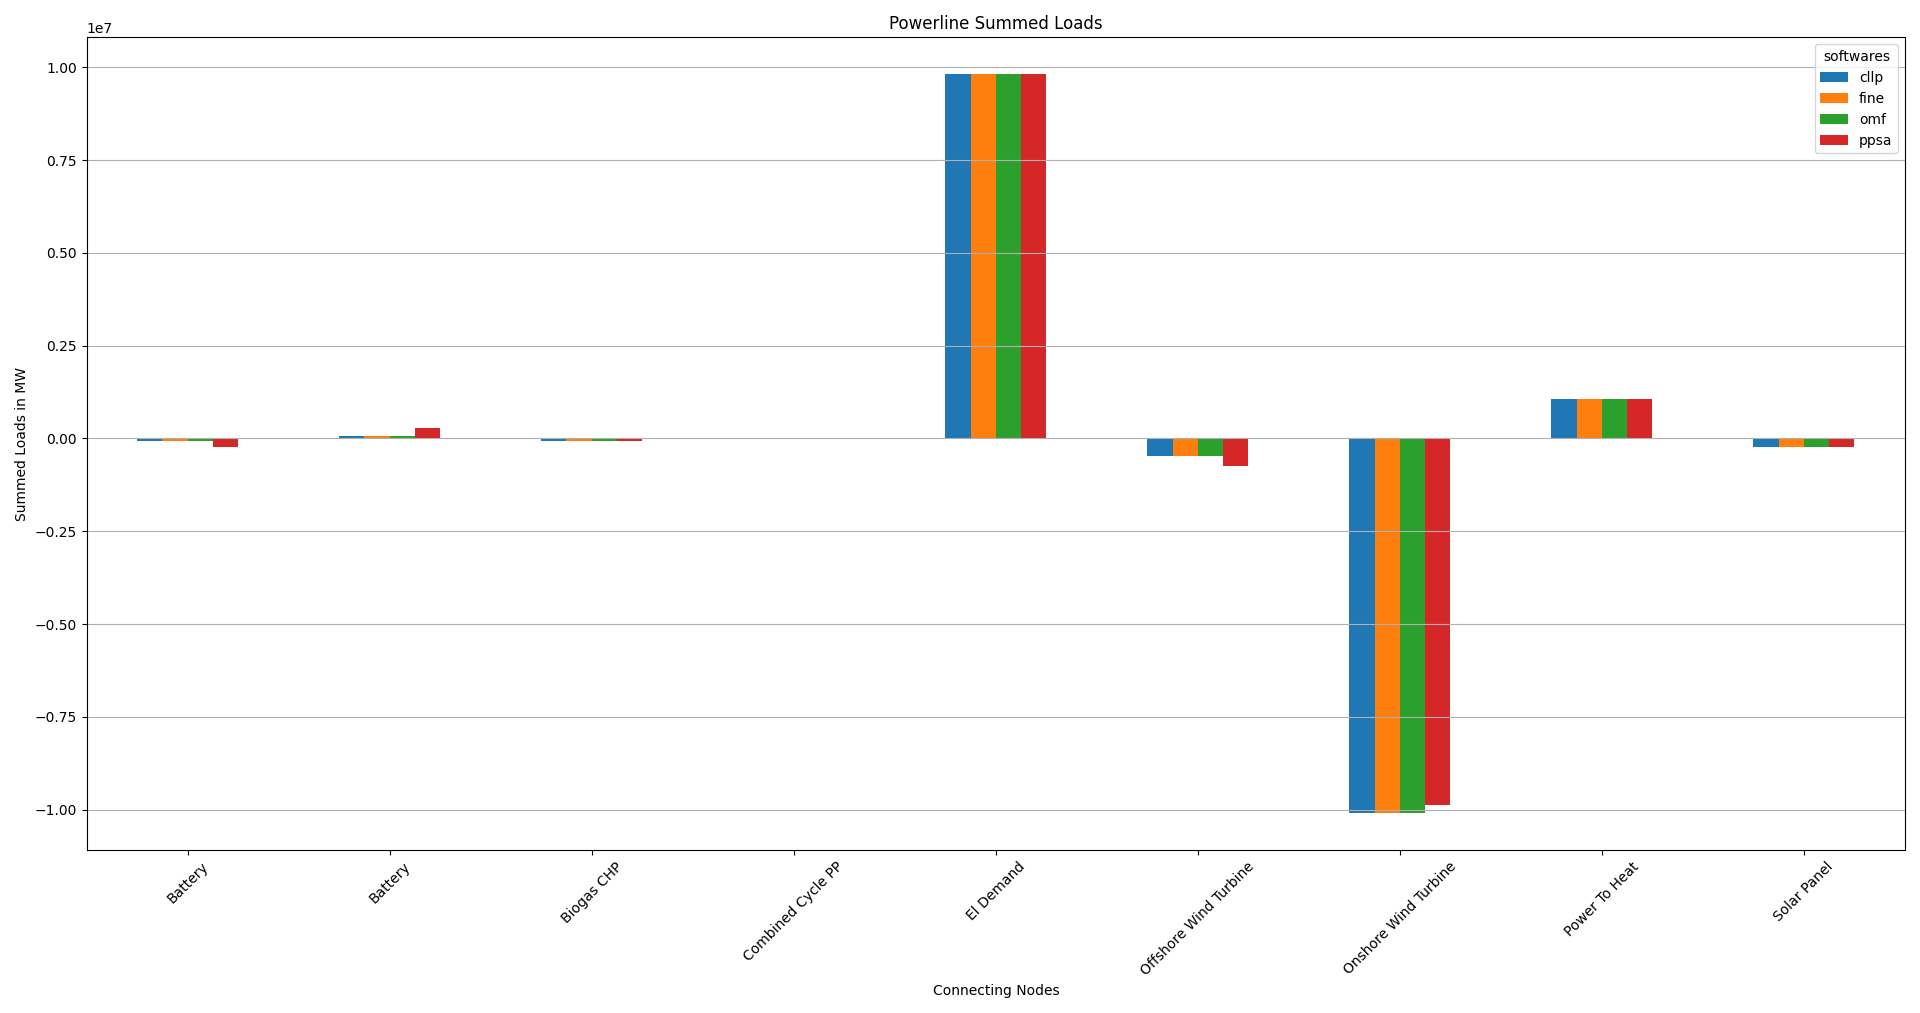
Powerline Summed Loads
Load-Powerline [MW] |
cllp |
fine |
omf |
ppsa |
Battery |
-59184 |
-59142 |
-59142 |
-242275 |
Battery |
69736 |
69681 |
69681 |
290281 |
Biogas CHP |
-66772 |
-66470 |
-66470 |
-73816 |
Combined Cycle PP |
-11270 |
-11512 |
-11512 |
-18191 |
El Demand |
9809506 |
9809506 |
9809506 |
9809506 |
Hard Coal CHP |
0 |
0 |
0 |
0 |
Hard Coal PP |
0 |
0 |
0 |
0 |
Lignite Power Plant |
0 |
0 |
0 |
0 |
Offshore Wind Turbine |
-480373 |
-479668 |
-479668 |
-733059 |
Onshore Wind Turbine |
-10089236 |
-10090424 |
-10090424 |
-9880008 |
Power To Heat |
1069849 |
1070091 |
1070091 |
1075836 |
Solar Panel |
-242253 |
-242060 |
-242060 |
-228272 |
Heatline Summed Loads
Load-Heatline [MW] |
cllp |
fine |
omf |
ppsa |
Biogas CHP |
-83465 |
-83088 |
-83088 |
-92271 |
Hard Coal CHP |
0 |
0 |
0 |
0 |
Heat Demand |
1116162 |
1116162 |
1116162 |
1116162 |
Heat Plant |
0 |
0 |
0 |
0 |
Heat Storage |
-110220 |
-109928 |
-109928 |
-150745 |
Heat Storage |
136673 |
136245 |
136245 |
191931 |
Power To Heat |
-1059150 |
-1059390 |
-1059390 |
-1065077 |